M Pattern Forex: How to Read the Double Top Backwards (and the W Double Bottom)
Dylan Forexia7 min read
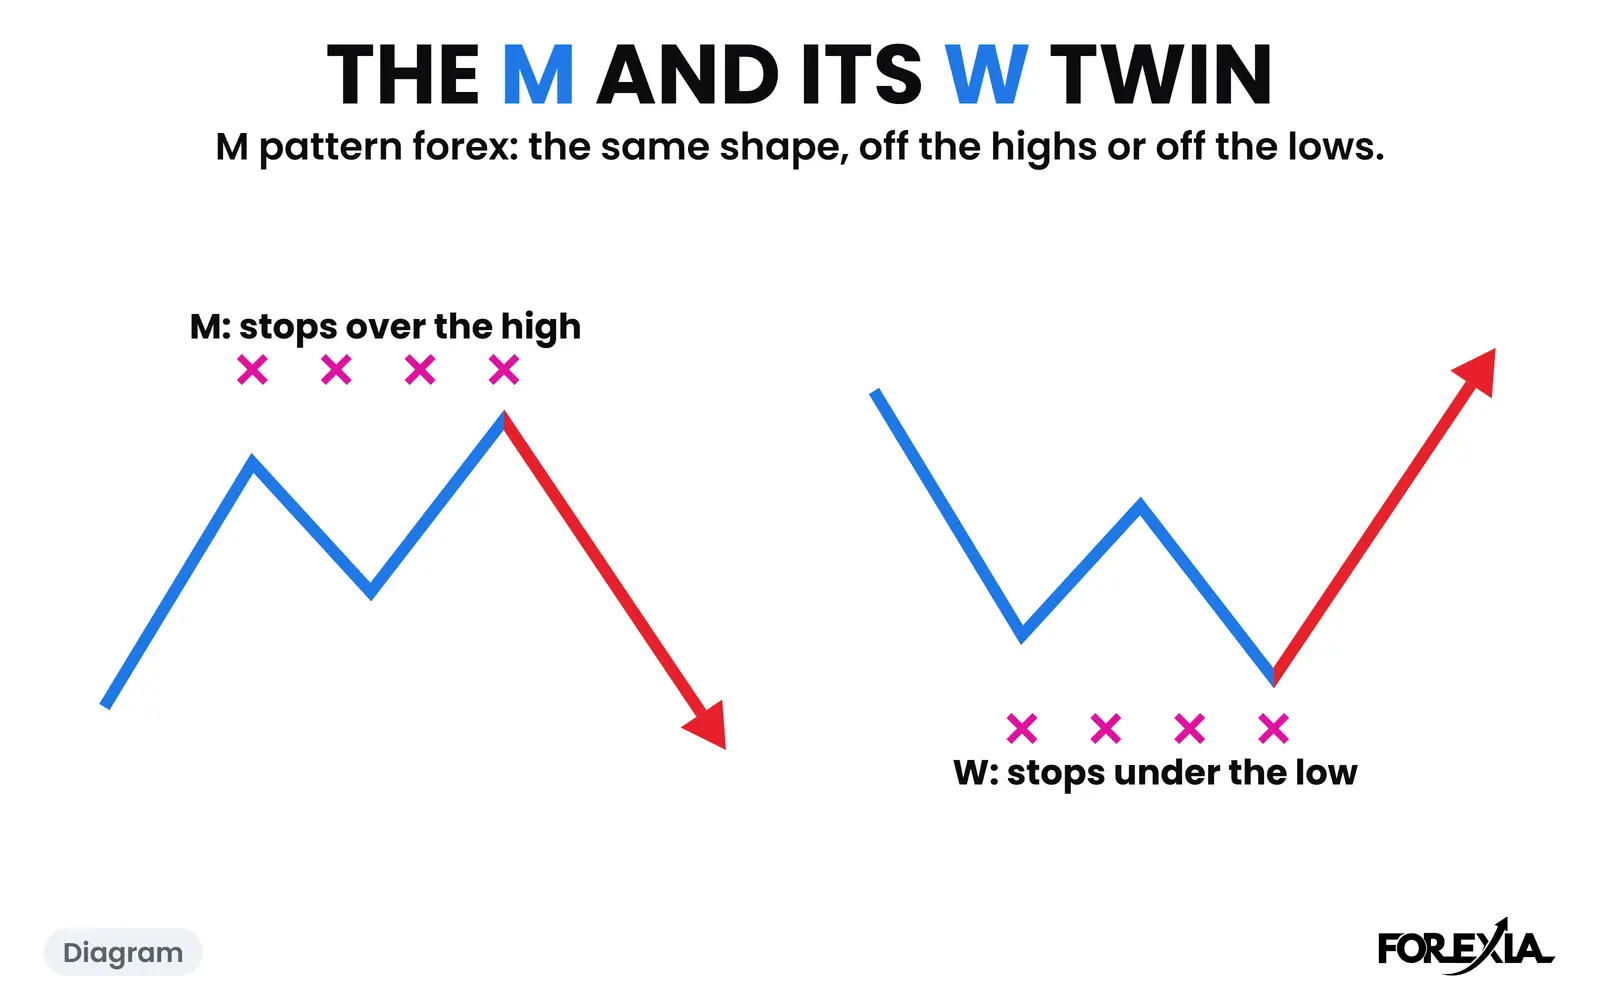
The M pattern in forex is a double top: two highs with a pullback between them, shaped like the letter M. Its twin, the W, is a double bottom. The textbook reads the M as a sell. We read it backwards: the second top exists because of the stops the first one left, and a real day shows why.
Our own word for these shapes is M & W Reversals, an M off the highs or a W off the lows, from a clear Asian range, in London or New York. That page gives the anatomy on two days. This one reads what each shape traps, on a day the glossary does not use, and why the range under it matters. Times are New York, candles are 15-minute Dukascopy, and on gold $1 counts as 1 pip.
What is the M pattern in forex, as the textbook tells it?
The book's version has three parts: two peaks at about the same price, a dip between them called the neckline, and a sell when price closes under that neckline. The stop goes above the peaks, and the target is the pattern's height again under the neckline. A W is the mirror, with a buy over its neckline. They are among the most drawn forex reversal patterns, and you can find them on any chart and any market.
That is the problem. A shape that can be drawn anywhere says very little. We counted 983 of them on 15-minute candles on seven dollar majors and gold, from 6 April to 1 October 2026: 505 tops and 478 bottoms. In 680 of them price never closed through the neckline that day before going past the peak. Those are shapes on candles, not trades, and why double tops and double bottoms fail goes through the failures. The double top double bottom section of our hub has the rest of the count.
| M (double top) | W (double bottom) | |
|---|---|---|
| Forms | Off the highs | Off the lows |
| The first leg shows the crowd | A new high to buy | A new low to sell |
| The book's trade at the second | Sell, stop over the first high | Buy, stop under the first low |
| Where the stops rest | Over the first high | Under the first low |
| What we read the second leg as | The hunt for those stops | The hunt for those stops |
How does an M read backwards on a real day?
USD/JPY on Wednesday 15 July 2026 shows the shape from a clear Asian range. Asia ran 161.965 to 162.259, 29 pips, and Tuesday's high sat above it at 162.468.
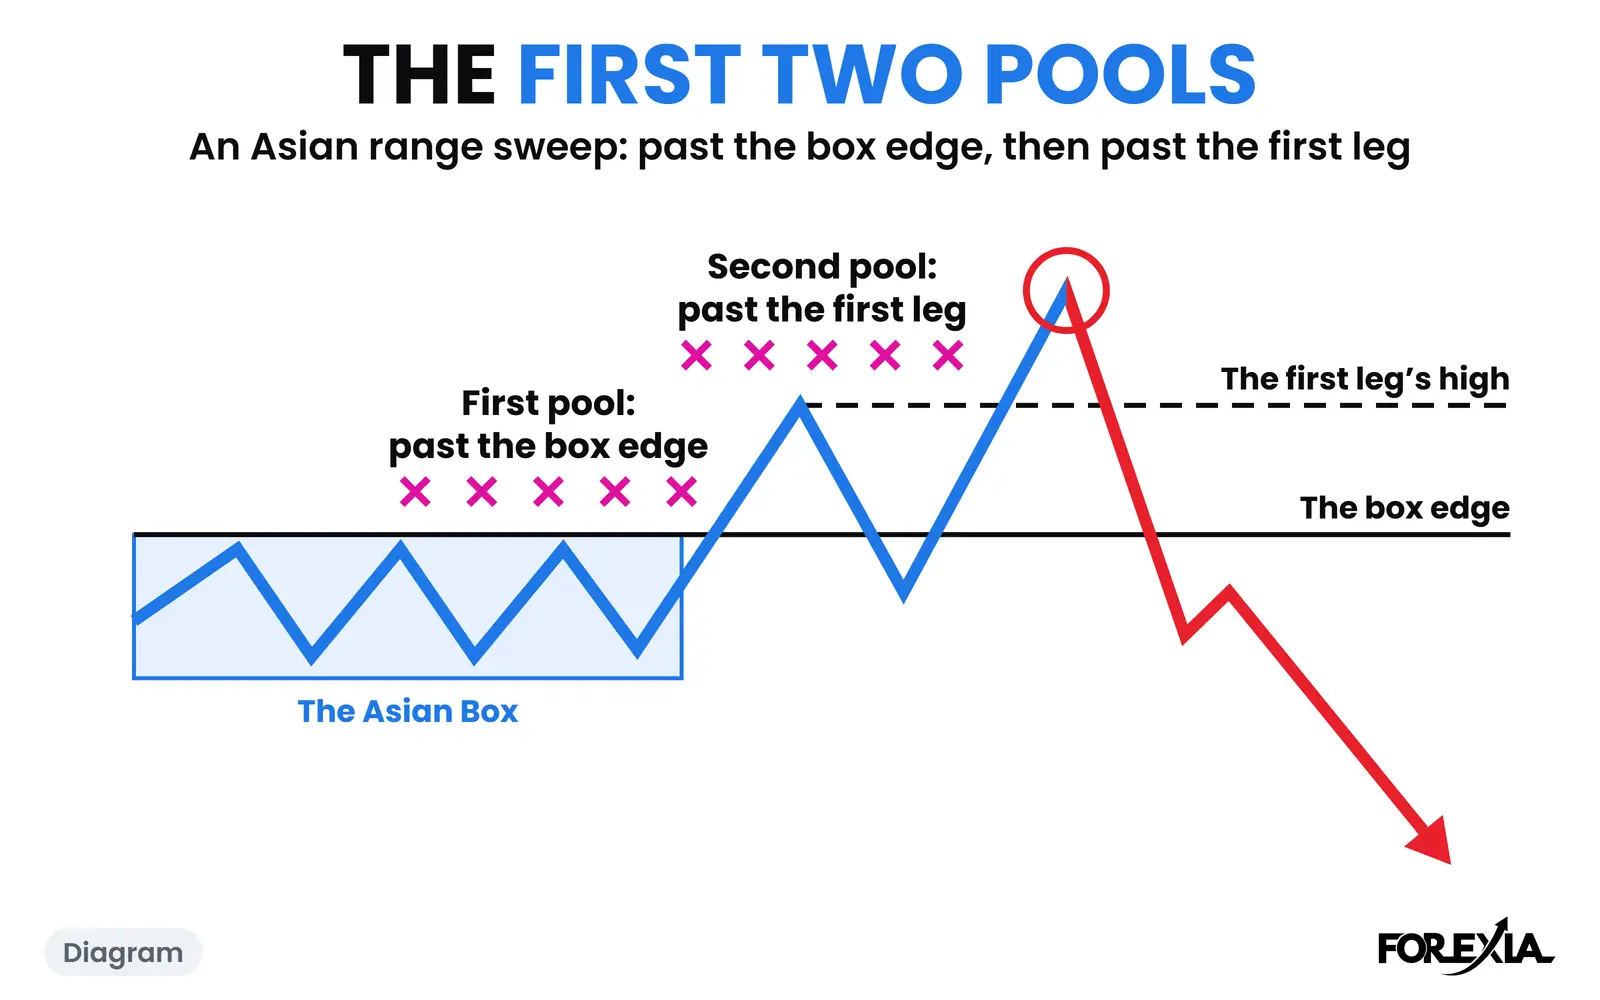
London broke the top of that box. By 04:00 price had reached 162.349, 9 pips over it: a new high of the day, and the London Breakout the crowd buys. From the first seat that is the move. Others sell it as resistance, and they put a stop just over it.
Price pulled back to 162.243 at 05:00, a shade inside the box. A seller of 162.349 now looks right and a buyer now looks early. Both have exits on the chart, and the seller's is one line.
Then London climbed slowly, with no release due. At 06:15 price reached 162.421, 7 pips past the first leg. That second top is what makes an M, and it is what we call the Second Leg Climax when it is violent. This one was not. It was a slow walk through the sellers' stops, and we read it as the stop hunt, the liquidity sweep of the stops over the first leg. It stopped 5 pips short of Tuesday's high, which never came into it.
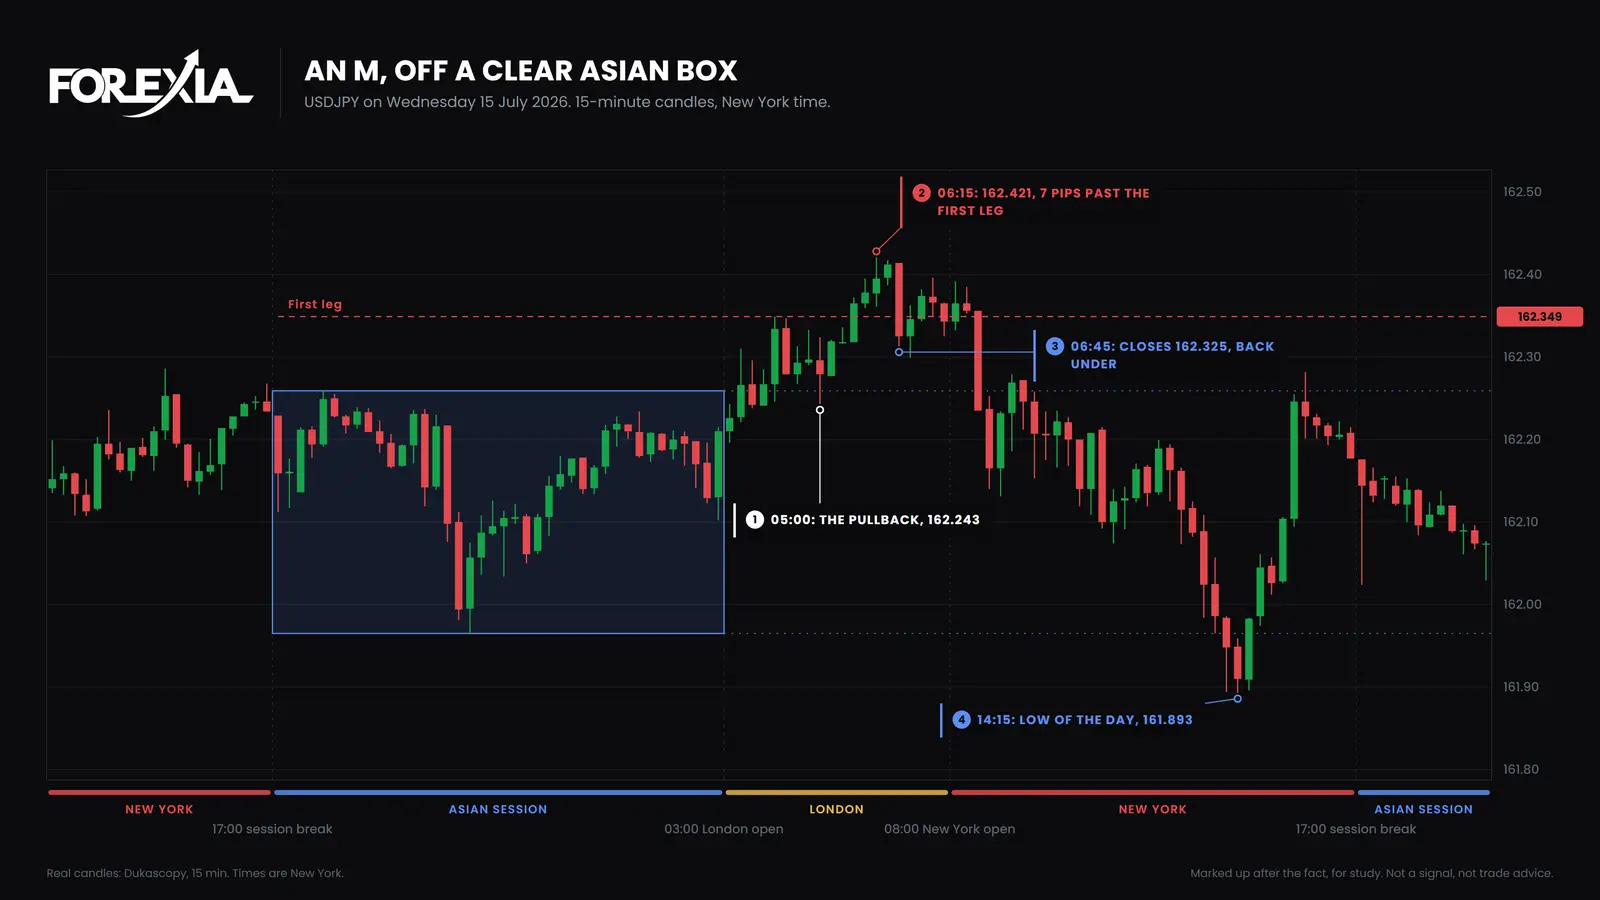
The 06:45 candle closed at 162.325, 2 pips back under the first leg. US producer prices at 08:30 carried it further, and that candle closed at 162.235. The Fed chair testified at 10:00. The move ground on through New York to 161.893 at 14:15, 53 pips under the high. It did not stay there. By 15:30 price had come back to 162.255, and the day ended at 162.177.
Read that again from the stops. The second top was not a stronger resistance. It went through the place the first top's sellers had put their exits, and only then did the pair turn.
How does the W look on gold?
The same read, in a mirror. Gold on Thursday 27 August 2026 had an Asian box of 49 pips, 4593.94 to 4642.53, with Wednesday's low under it at 4582.78. The glossary page gives its legs. What this day adds is that the pools come in a queue.
London went through Wednesday's low at 05:30, so whoever bought that level was stopped before the W had even started. The first leg came at 06:00, 4568.89. Price pulled back to 4600.86 at 08:00, and the crowd that sold the break now had stops overhead while buyers of that low had theirs just beneath it. At 09:45 the second leg reached 4564.23, 5 pips past the first, and closed at 4572.20, back over it.
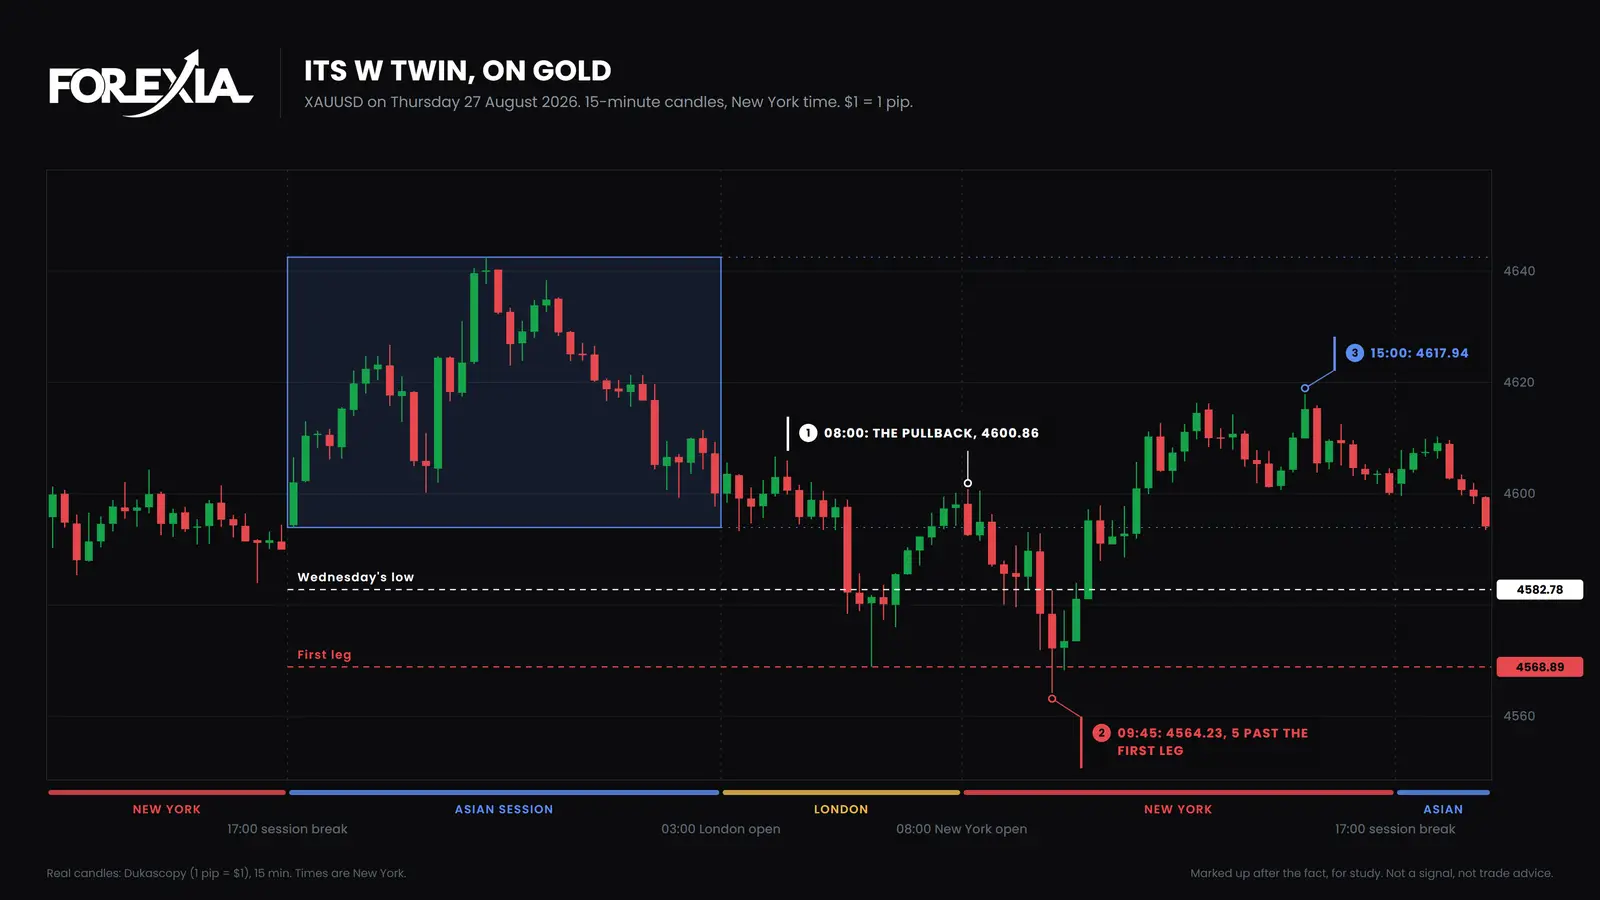
Price rose 54 pips to 4617.94 by 15:00, then gave a third of that back and ended the day at 4600.15. Most diagrams show a clean run off the second low. This one was not clean, and we show it for that reason.
Why does the Asian range matter to the M and the W?
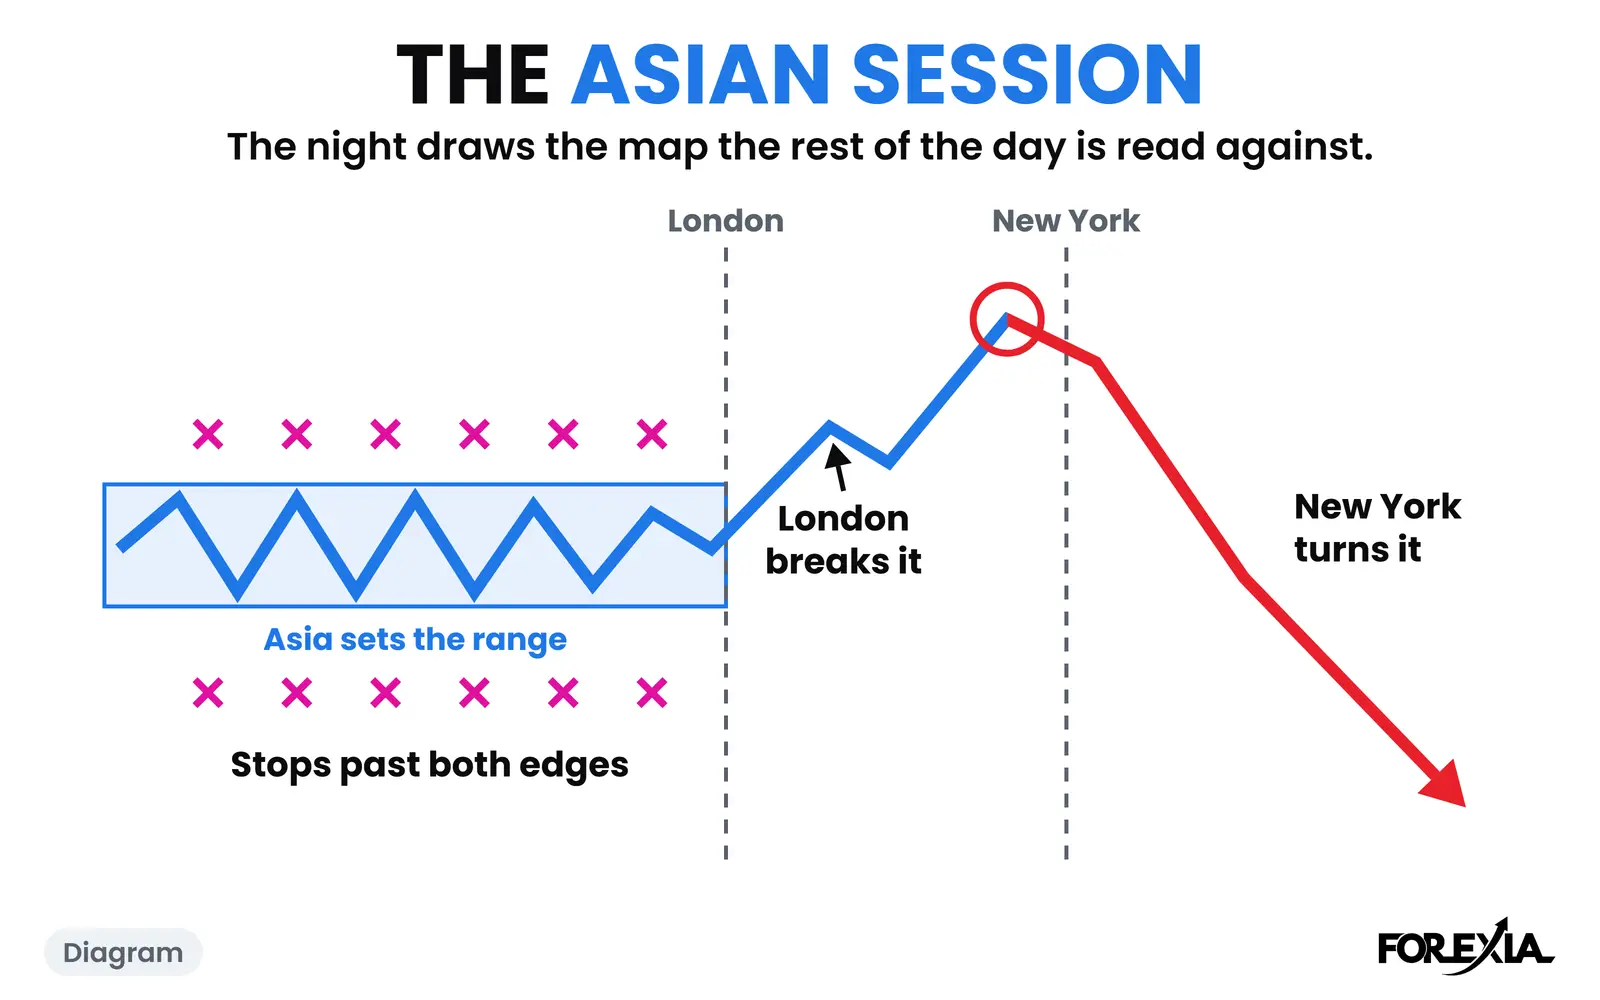
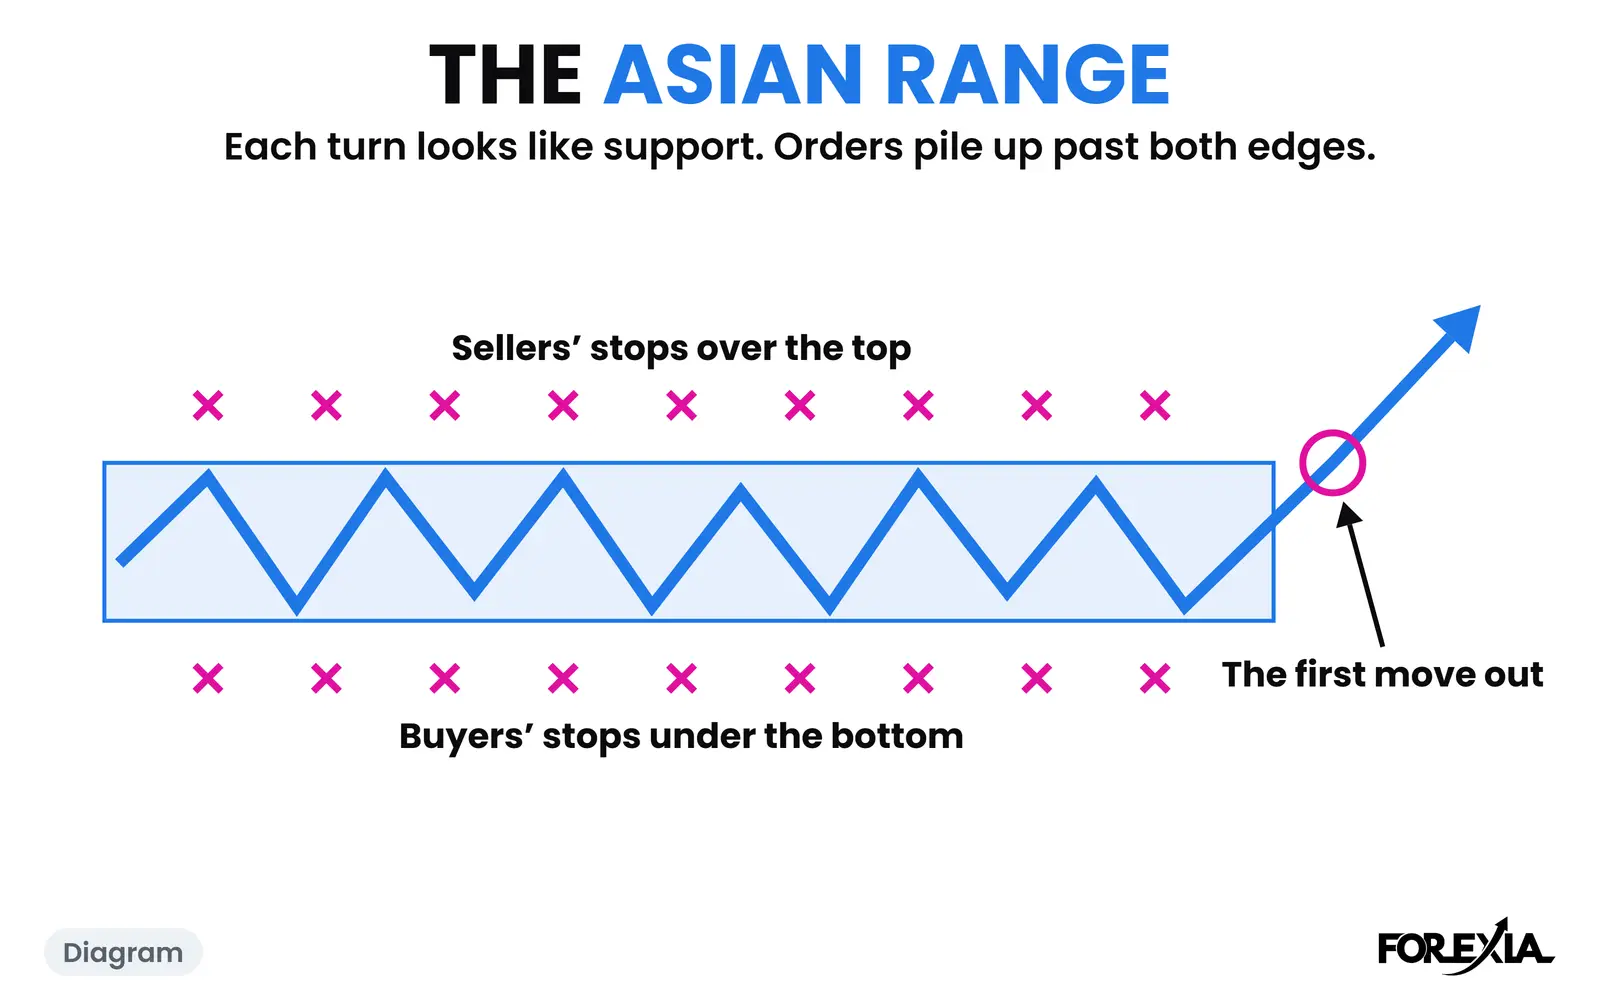
Because a clear Asian box gives the whole market two obvious lines, and hours to set its orders around them. A first leg out of it starts from a place everybody can see. We read a clear box as the reason we can name the stops at all. That is our reading, and it is a reason to read a chart that way rather than a result: in our own test, a clear range did not rescue the setup as a fixed rule.
Two other boxes were not so tidy.
GBP/USD on Thursday 13 August 2026 made an M, and the glossary page has its legs. Look at its box instead. Before UK GDP at 02:00, the low of the session was 1.34865. The release pushed that to 1.34742 by 02:30, so about half the box came from one half-hour.
Gold on Wednesday 9 September 2026 had a box of 65 pips that rose all session, so the first leg started from a market that had already travelled. That day's second leg was violent, and price ended the day still inside the box, as what is the second leg in a reversal shows.
Neither of those boxes stopped price turning. They are simply harder to read, and we would rather say so than draw the shape on every chart. For more dated examples, see a GBP/USD M from August and a gold W from August.
What does each seat see in an M?
The three seats read that yen morning differently:
- Retail sees a breakout, a pullback and a second top, and each is a fresh reason to buy or sell.
- The market maker's seat, as we read it, sees a crowd on each side of 162.349, with one group's exit just over that line and the other's under the pullback.
- The observer sees a line, a run 7 pips past it, and a close back 30 minutes later. The observer can say all of that without claiming to know who sold.
Does the M pattern work?
As a picture of what happened, yes. As a rule, not on our evidence. Run as a fixed rule, our own test of the setup did not make money, and both the M or W version and the plain hunt lost after costs. Both days above turned, and that is why they are here. A reversal seen afterwards is not a setup. Our price action trading page covers what the rest of the count says, and M and W vs double top and bottom sets the names side by side.
Common mistakes
Each of these reads the letter and skips the stops behind it.
- Seeing an M in one high. At 04:00 on USD/JPY, 162.349 was only a new high.
- Reading a second top that goes further as a failed pattern. The book says so. We read that run as the pattern.
- Drawing it anywhere. A shape with no range under it and no session around it tells you little about whose stops are where.
- Taking the letter as a forecast. Gold's W gave back a third of its rise by the close.
Course 3 of ForexiaPRO, Reverse Price Action, teaches this read step by step in lesson 3.2.3, M and W Reversals: the Double Top and the Double Bottom.
Frequently asked questions
What is an M pattern in trading?
It is a double top: two highs at about the same price with a pullback between them, shaped like the letter M. The textbook reads it as a sign that a rise is ending, and sells when price closes under the low of that pullback, the neckline. A W is the same shape upside down, a double bottom.
Is the M pattern bullish or bearish?
The book calls it bearish, and it often comes before a fall. The name is a description, not a forecast. In our count of 983 double tops and bottoms on 15-minute candles, 680 never closed through the neckline that day before going past the peak. A shape on its own says little.
What is the difference between an M and a W pattern?
An M forms off the highs and a W off the lows. On an M the crowd's stops rest over the first high, and on a W under the first low. In our reading, the second leg goes to those stops in both cases. Everything else about them is a mirror.
Which chart should you read an M pattern on?
The shape appears on every chart. We read ours on 15-minute candles, in London or New York, from a clear Asian range, because that is where we can name the stops. We have no evidence that any one timeframe is better, and an M on one chart may be many small moves on a smaller one.