Forex Trade Simulator: Practise on Ten Real Days, Candle by Candle
Dylan Forexia6 min read
Trade a real day, one candle at a time
Pick one of the Playbook’s ten days. Step through it, place an entry, a stop and a target, and see what you would have made in R.
Now TUE 19:00, New York
Enter a stop and a target.
No order yet. Step on until you see a setup you would take, then place it.
This is your own practice on one past day, in hindsight and with no commission, spread or slippage (a gap is the one exception). It is not saved, not scored and says nothing about how any method does over many trades.
This forex trade simulator replays ten real, past trading days, one candle at a time, and lets you trade them. Step through a day, set an entry, a stop and a target, and it tells you what the trade would have made, in R. It runs in your browser with no account, and it saves and scores nothing.
The days are real and finished. The simulator is practice on the past, in hindsight, so use it to rehearse how you place orders and not to judge a method. For the ten days as a guided tour, see the Playbook.
How do you use the forex trade simulator?
Pick a day, step through it, place one order and watch it play out.
- Choose a day. The list holds the Playbook's ten days, each named by its pair and date. The chart opens at the start of the day and shows nothing that has not happened yet.
- Step forward. The Next candle button moves one 15-minute candle on. Play runs the clock for you, and it is left out if your device asks for reduced motion. Show the rest of the day jumps to the end.
- Set your order. Choose Buy or Sell, then an entry: at the price now, a limit (wait for a better price) or a stop (wait for price to break out). Type a stop and a target, or press Tap chart and touch the chart where you want each to sit.
- Place the order. The simulator tells you how far your stop is. That distance is 1R, the unit your result is measured in.
- Let it run. Step on until the order fills and then exits, or until the day ends. The result shows the fill, the exit and the outcome in R.
- Read the markup. When the day is finished the chart shows the whole day with its structure marked: the Asian range, the first leg, where stop losses rest and the stop hunt.
Start over clears your order and lets you try the same day again with different levels. Nothing carries from one round to the next.
What days does the simulator replay?
Ten days between 1 May and 18 September 2026, six of them a buy off the low and four a sell off the high, on seven markets: EUR/USD, GBP/USD, USD/CAD, NZD/USD, AUD/USD, USD/CHF and gold.
Each comes from Dukascopy's real candles, and none is drawn by hand. The chart shows 15-minute candles in New York time. Behind each candle sits its 1-minute path, which is what decides your fills. If your stop and target both lie inside one 15-minute candle, the simulator uses the order of the minutes, not a guess.
The days were chosen for the Playbook as textbook examples of one structure, and the page that tells that story is the Playbook. That choice matters here: these are days where a move happened and its shape is clear. A random day is usually less tidy, and many days have no clean trade at all.
A worked example on EUR/USD, 15 July 2026
The chart below is the first day in the list. EUR/USD fell to its low of 1.14059 at 08:00 New York time, and rose to its high of 1.14825 at 14:30, a day range of 77 pips.
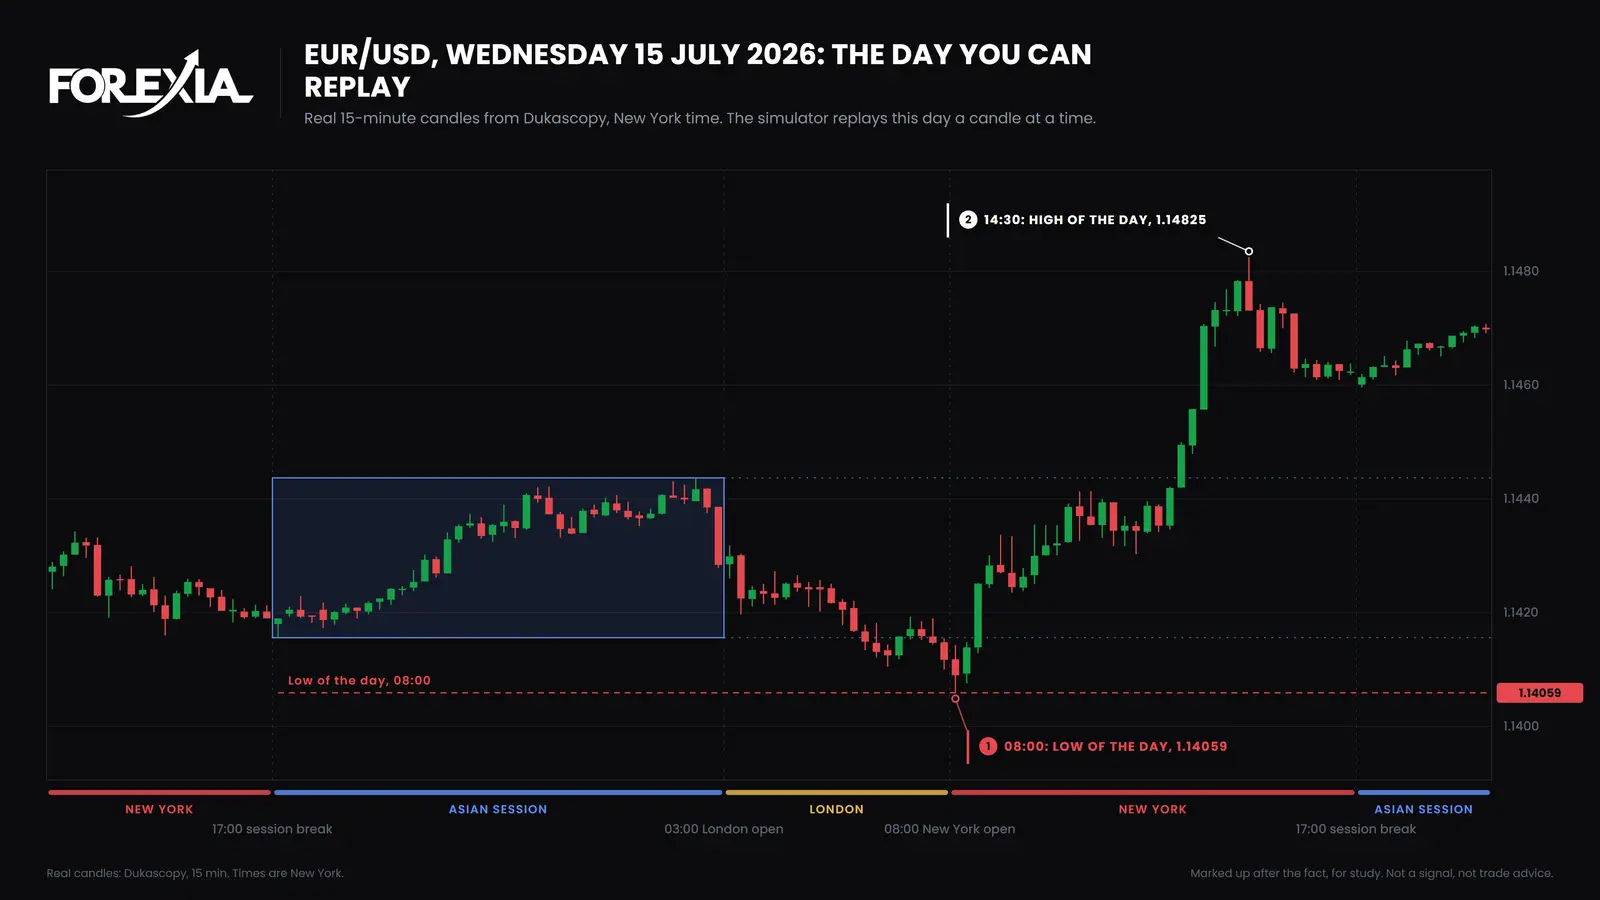
Two orders, both placed at the start of the day and both run through the simulator's own fill rule:
- A limit buy at 1.14100, stop 1.14030, target 1.14400. The limit fills at 07:55 New York time. The stop sits 7 pips away, so that is 1R. The target, 30 pips above, is reached at 10:48 and the trade ends there.
- A limit sell at 1.14250, stop 1.14350. It fills at 20:00 on the Tuesday evening, when the day begins. The stop is 10 pips away and is touched at 21:08 the same night. The trade loses 1R.
The first order only worked because it was written knowing where the low was. That is hindsight, and it is the main limit of any simulator on a past day. The second is a plain loss, and it is as useful: it shows what a stop costs. If you place a stop 1 pip beyond a level you can already see on the chart, you have learned something about the chart and nothing about your method.
What does the simulator assume?
It assumes a clean market, and it states its rules so that you can check them.
- Fills happen at your price. A level fills where price travels through it. A buy limit fills at your limit, a stop at your stop, a target at your target.
- A gap is the exception. If a minute opens beyond your level, the order fills at that open. A stop that gaps fills worse than your stop, so it can lose more than 1R. A target that gaps fills better.
- There are no costs. There is no spread, commission or slippage. A broker would add them, and your real result on the same orders would be lower.
- One order at a time. You place one entry with one stop and one target. It does not scale in, move a stop or take half off.
- R is measured on your plan. It is the distance from your planned entry to your stop. A market order plans from the price it fills at.
- Orders look forward only. An order placed at a given candle can fill only from that point on.
What is the difference between a simulator and paper trading?
Paper trading is trading the live market with pretend money, and a simulator is trading a finished stretch of history.
On a demo account, a day takes a day, you face real spreads and slippage in the broker's own feed, and the future is unknown. In a replay, a day takes minutes, so you can see many more situations in a week. But you know the day is in the past and that a move happened, which makes it easier than the live market. The sensible use is to do both: replay to practise the mechanics and the order of decisions, and demo or small size to meet the uncertainty.
Neither one is evidence that a method works. A method is judged over a large number of trades, in the data, and the simulator makes no claim about that. For a way to count a setup over many real days, see price action trading, where the patterns are set out on dated days.
How can you get more from a replay?
Decide before you step, and write it down.
- Set the stop first. Choose where the idea is wrong, then work out the target. The risk-reward calculator does the sum for a target in R.
- Find the level before the candle. Pick your entry and stop with the chart at the start of the day, and only then press Next candle.
- Try the same day twice. A different stop on the same day shows how much the placement mattered, apart from the idea.
- Look at the hours. The day's turns often come at a session's open, and the forex sessions guide shows when those fall in New York time.
- Read what the markup says. After a round, the liquidity sweep page and the stop hunt page explain the marked stop hunt on the chart and what it means for where stops rest.
Our other calculators are on the tools page. The simulator links to the Playbook because the Playbook is the argument and this is the practice: the first says what the structure is, and this lets you try placing an order against it.
What can the simulator not tell you?
It cannot tell you how a method performs, how you will feel with real money, or what a day with no clean trade looks like. It shows ten days where something happened, picked for being clear.
It does not score you, and it keeps no history, on purpose. A running score on ten days would invite you to read it as a result, and it is not one. The page that walks through the structure on these ten days is the Playbook.
Frequently asked questions
Is this forex trade simulator the same as paper trading on a demo account?
No. A demo account trades the live market with pretend money, so you wait for real time to pass. This simulator replays one finished day, so a full day takes minutes. It has no account, no balance and no broker, which makes it practice on a past day and not a record of anything.
Are the days in the simulator real prices?
Yes. Each is a real, past day from Dukascopy's candles, with the 15-minute candles shown and the 1-minute path behind them used to decide fills. Nothing is drawn or edited by hand. The ten days run from 1 May to 18 September 2026.
Does the simulator include spread, commission or slippage?
No. A fill happens at exactly the price you set, with one exception: when a minute opens beyond your level, it fills at that open, so a stop can lose more than 1R. A broker would add costs, so real results would be worse than the simulator's on the same entries.
Does a good result in the simulator mean my method works?
No. It is one day, seen in hindsight, so you may find yourself placing orders at the level you already know mattered. One result tells you nothing about how a method does over many trades. Use it to practise placing an entry, a stop and a target in order.
Can I use it on my phone, and does it save anything?
It runs in your browser on a phone or a computer, and you can tap the chart to place a price. It saves nothing and sends nothing: close the page and the trade is gone.