Which Day Is the Weekly High in Forex? A Real Week of Eight Markets
Dylan Forexia7 min read
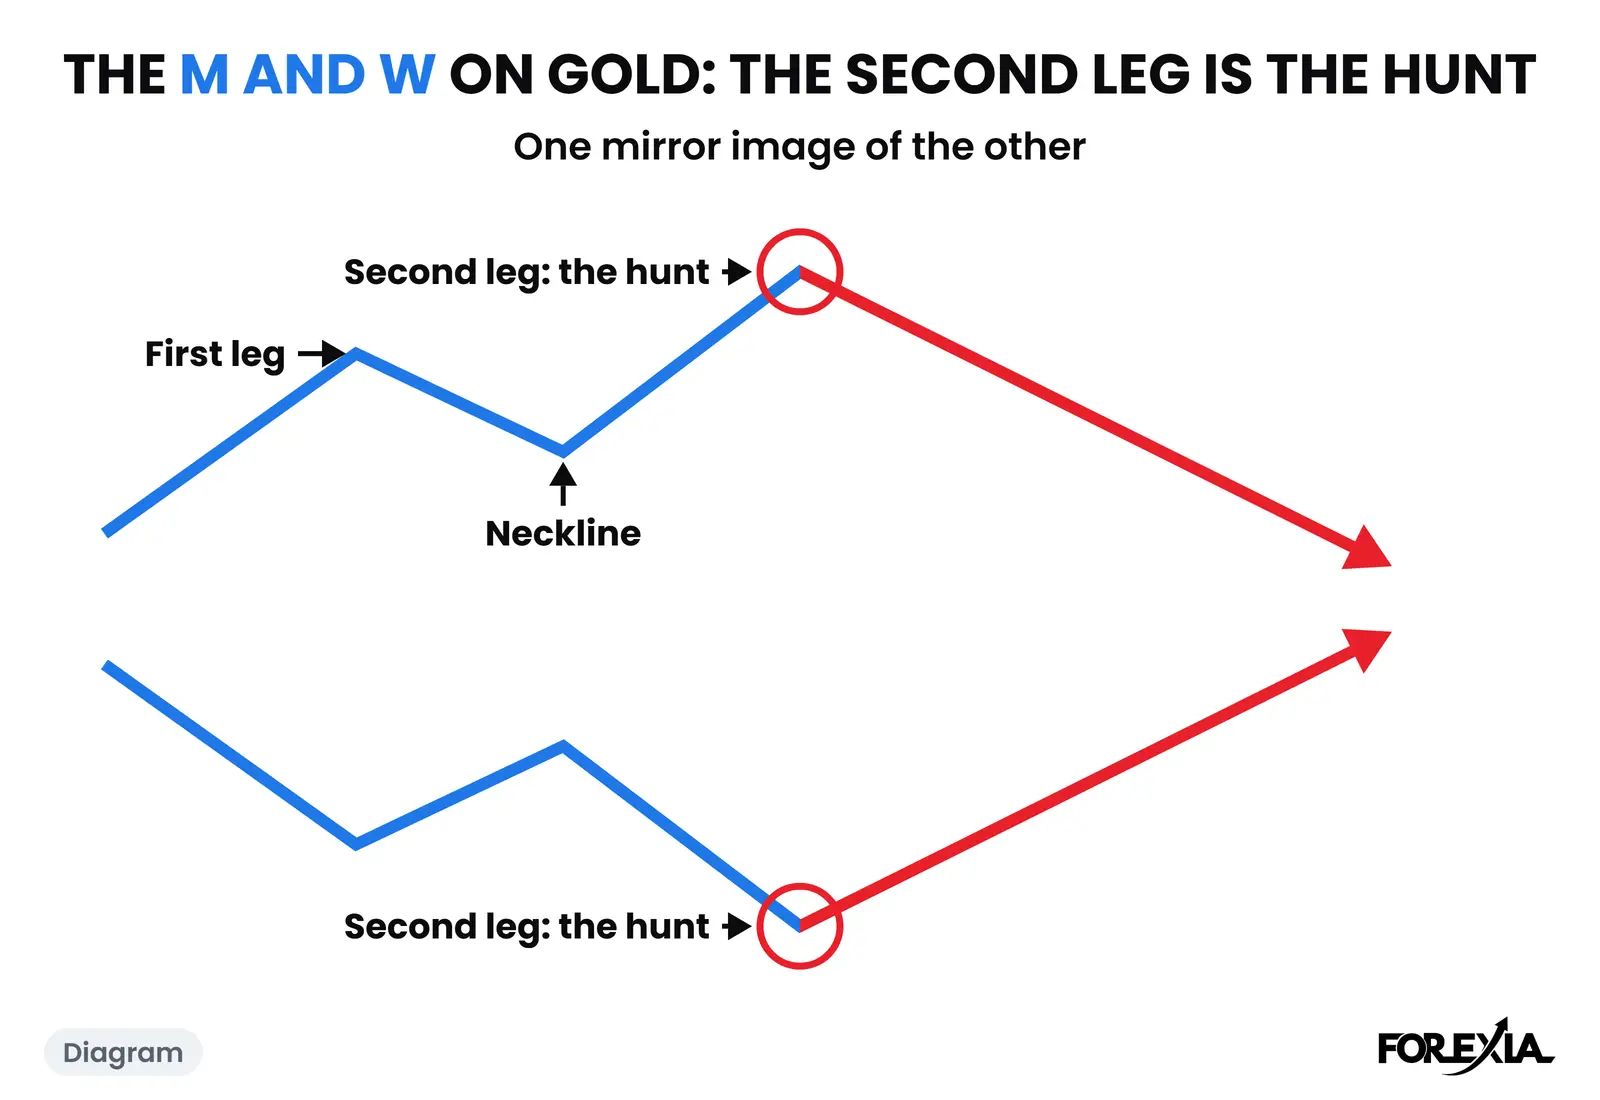
Which day is the weekly high in forex? There is no fixed day, and this page gives no count of it. What it gives is one week, read market by market: in the week of 31 August 2026 seven of our eight markets made their extreme in Wednesday's session, and NZD/USD made its own in Tuesday's. That is one week of one dollar, not a rule.
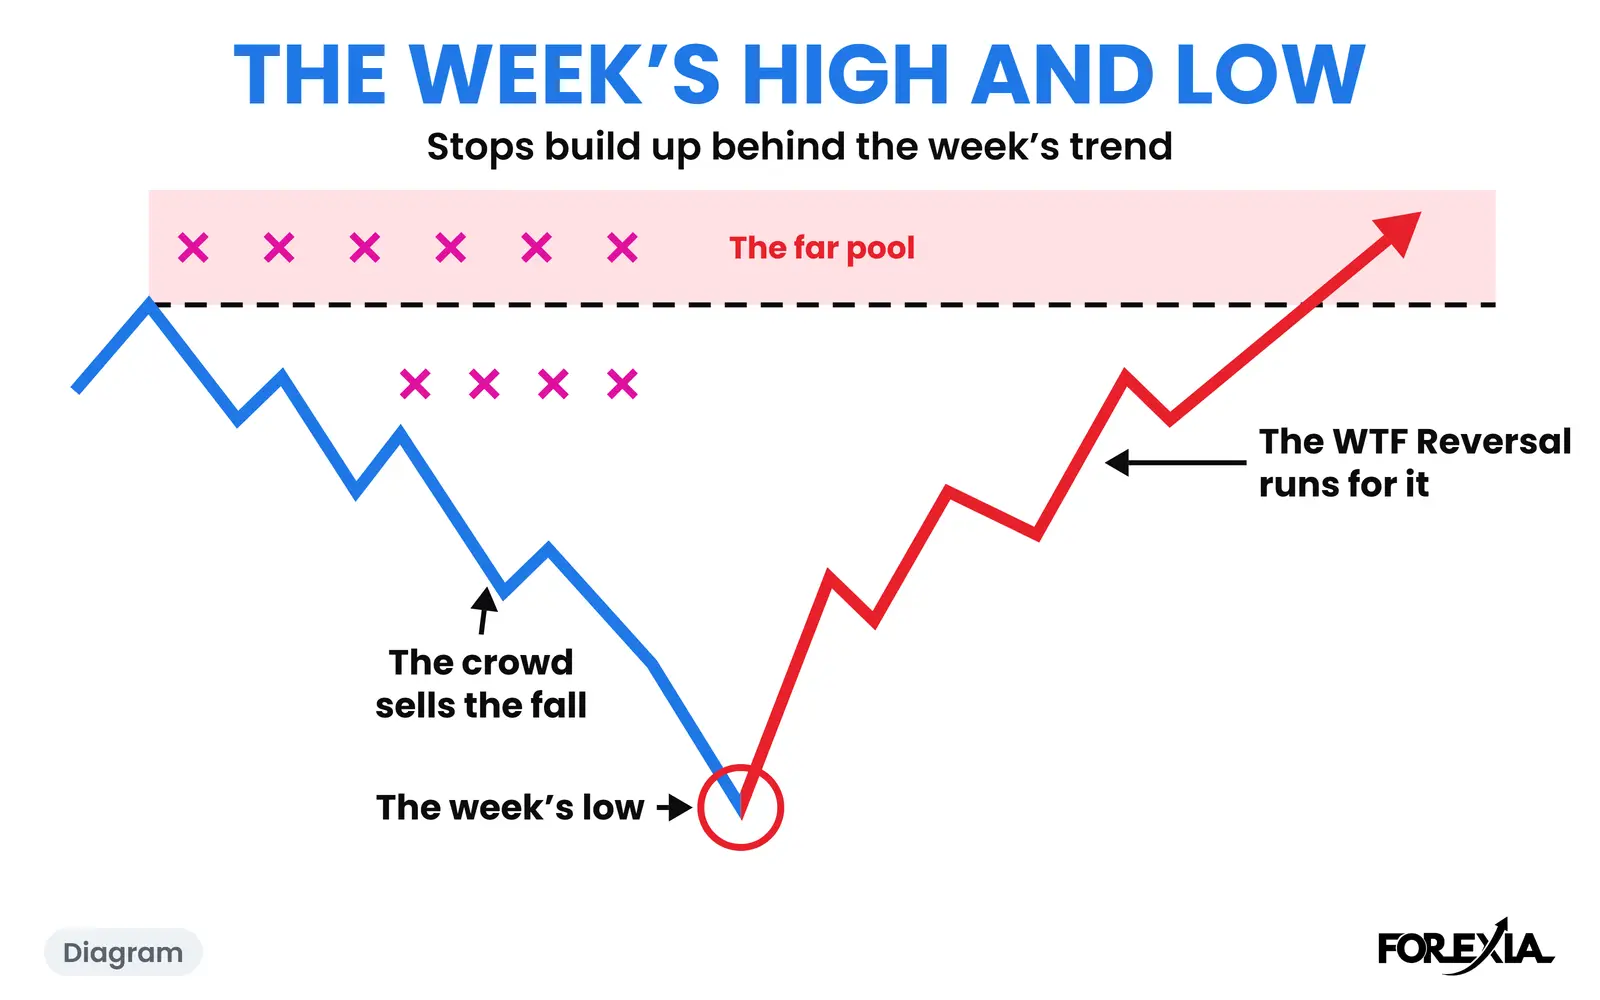
Below, each market's extreme with its time, what came after it, and why eight turns on one dollar are closer to one event than eight. The idea behind them is the Week's High and Low, and the wider guide is the weekly cycle.
Which day is the weekly high in forex on eight markets in one week?
For this week, it was Wednesday's session on seven of them. A forex day here runs from the 17:00 New York session break, so Tuesday evening already belongs to Wednesday. Each extreme below is the week's high or low and is only known now that the week is over.
| Market | Extreme of the week | Price | Time, New York | Session | What came after |
|---|---|---|---|---|---|
| EUR/USD | Low | 1.15662 | Wed 03:00 | London | 75 pips up to 1.16412 by Thursday |
| AUD/USD | Low | 0.71210 | Wed 06:00 | London | 93 pips up to 0.72142 by Friday |
| USD/CAD | High | 1.39393 | Wed 06:15 | London | 174 pips down to 1.37648 by Thursday |
| USD/CHF | High | 0.81565 | Wed 06:30 | London | 104 pips down to 0.80520 by Thursday |
| GBP/USD | Low | 1.34743 | Wed 08:45 | New York | 75 pips up to 1.35490 by Friday |
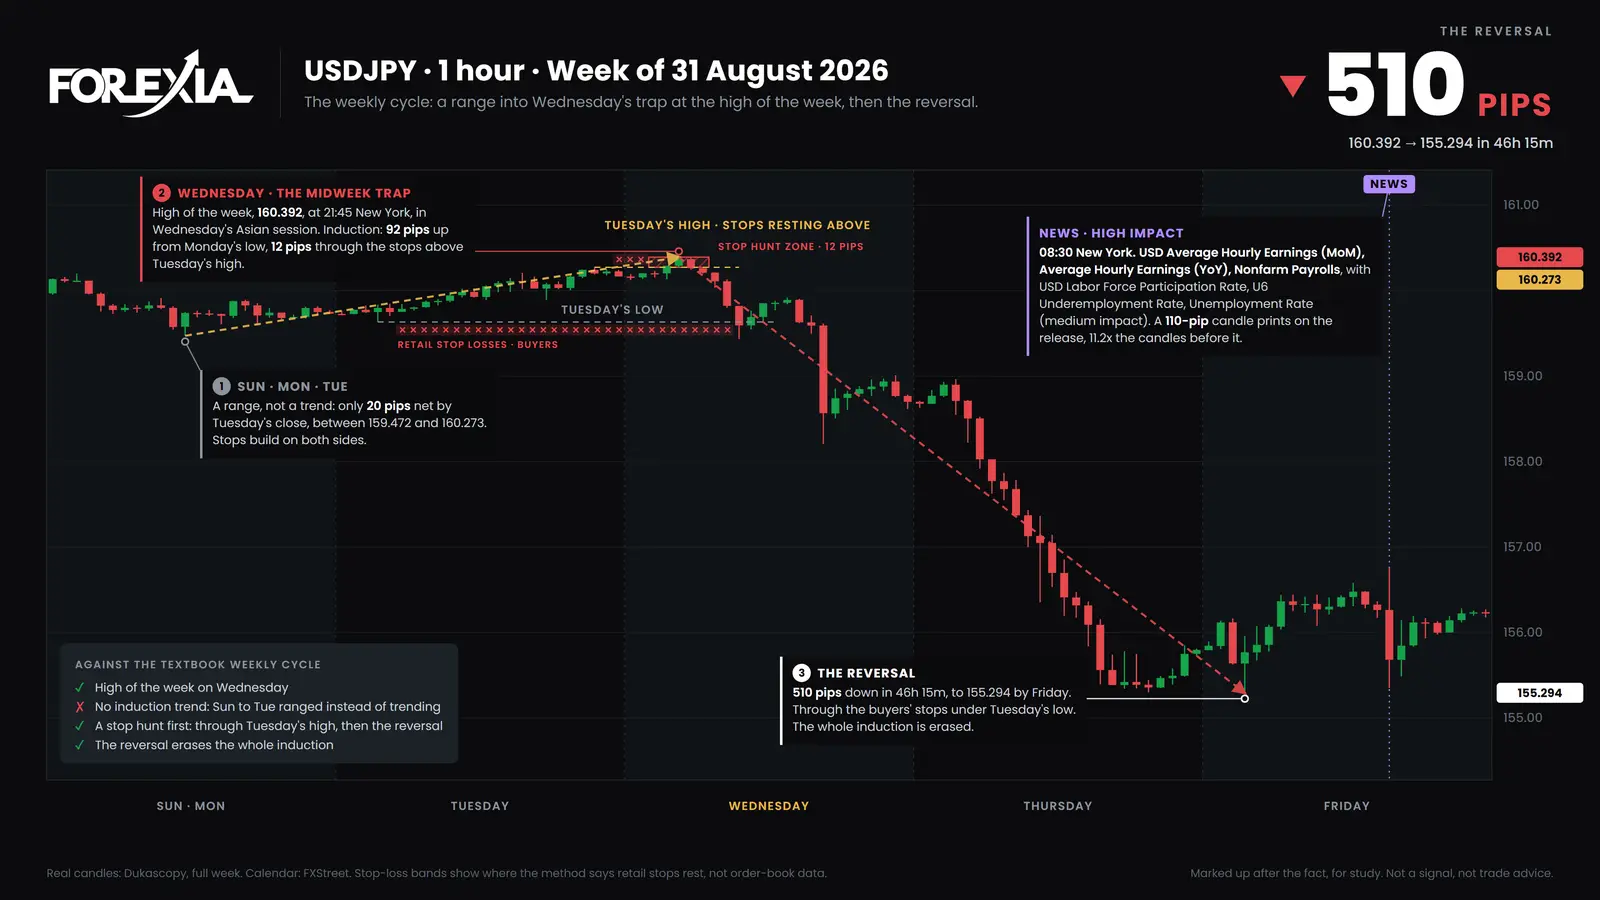
| USD/JPY | High | 160.392 | Tue 21:45 | Wednesday's Asian | 510 pips down to 155.294 by Friday |
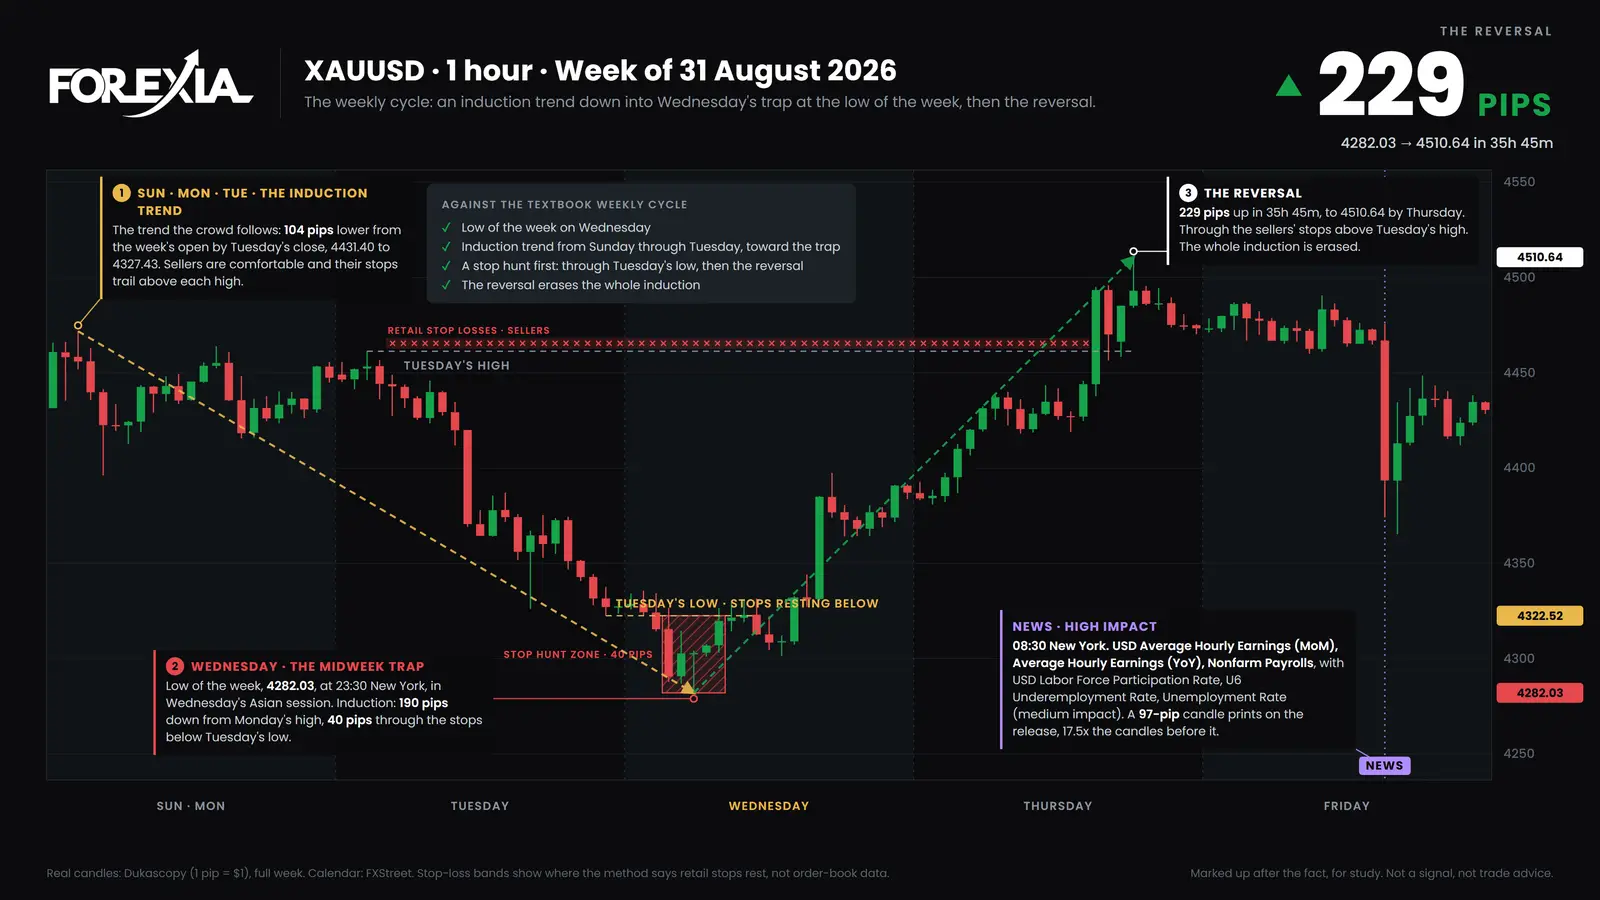
| Gold | Low | 4282.03 | Tue 23:30 | Wednesday's Asian | 229 pips up to 4510.64 by Thursday |
| NZD/USD | High | 0.59286 | Mon 20:15 | Tuesday's Asian | 127 pips down to 0.58017 by Wednesday |
Gold is counted at $1 to the pip. Each run is the move from the extreme to the price named, and the hours it took ran from 30 to 46 on all eight. Every one of those extremes came before the jobs report at 08:30 on Friday, so none was made by it.
What did the USD/JPY week look like?
It was the biggest move of the eight. USD/JPY was only 20 pips from its open by Tuesday's close, with Tuesday's high at 160.273 and low at 159.634. At 21:45 on Tuesday, in Wednesday's session, price reached 160.392, the high of the week and 12 pips over Tuesday's high. The 22:00 hour closed back under that high at 160.263.
Price then fell. Wednesday closed at 158.699, 147 pips down on the day, and Thursday at 155.797. By 20:00 on Thursday it was at 155.294, 510 pips off the high. The jobs report came at 08:30 on Friday, about 12 hours after the high, so it did not cause the fall.
And the gold week?
Gold ran a trend into the low. It opened the week at 4431.40, and by Tuesday's close it was at 4327.43, 104 pips under the open. Monday's high was 4471.77 on Sunday evening, and Tuesday's high 4461.27, so we read the crowd's stops as resting above those. At 23:30 on Tuesday, in Wednesday's session, gold made the low of the week at 4282.03, 40 pips under Tuesday's low.
By 08:45 on Thursday a candle had closed at 4493.40, over Monday's high. By 11:15 gold was at 4510.64, 229 pips off the low and 39 over Monday's high. Only USD/CHF and gold had a trend into the turn that week. EUR/USD, AUD/USD, GBP/USD, USD/CAD and USD/JPY were between 9 and 20 pips from their opens by Tuesday's close, and NZD/USD was 2 pips from its open on Monday's close, so they ranged.
What does the table not show?
It does not show why each extreme was made, only when and how far. The pips are in each market's own units, so a 510-pip fall on USD/JPY cannot be set beside 75 on EUR/USD, and the chart write-ups only call it a hunt where price went past an earlier level and came back. In the GBP/USD row, price ran 31 pips past Tuesday's low, which the write-up marks as more than a hunt.
It also does not show prints made at the open. A level set in the week's first minutes, when spreads are wide, can differ between data feeds: a Monday low on AUD/USD in the week of 7 September 2026 was printed at 17:15 on Sunday, and on OANDA's feed it sits about 4 pips higher. Check any level made at the open on a second chart before leaning on it. Last, the table holds no week that trended into Friday. We only draw a weekly cycle chart when the week turned, so such a week would not be in it.
Why do eight markets turn together?
Because they share a dollar. Seven of the eight are currency pairs quoted against it, and gold is priced in it, so a move in the dollar shows up on all of them. That is why eight turns in one week are closer to one event than eight, and why this week cannot show that Wednesday is special. On NZD/USD the high came on Monday evening, in Tuesday's session, and the fall of 127 pips was over by Wednesday.
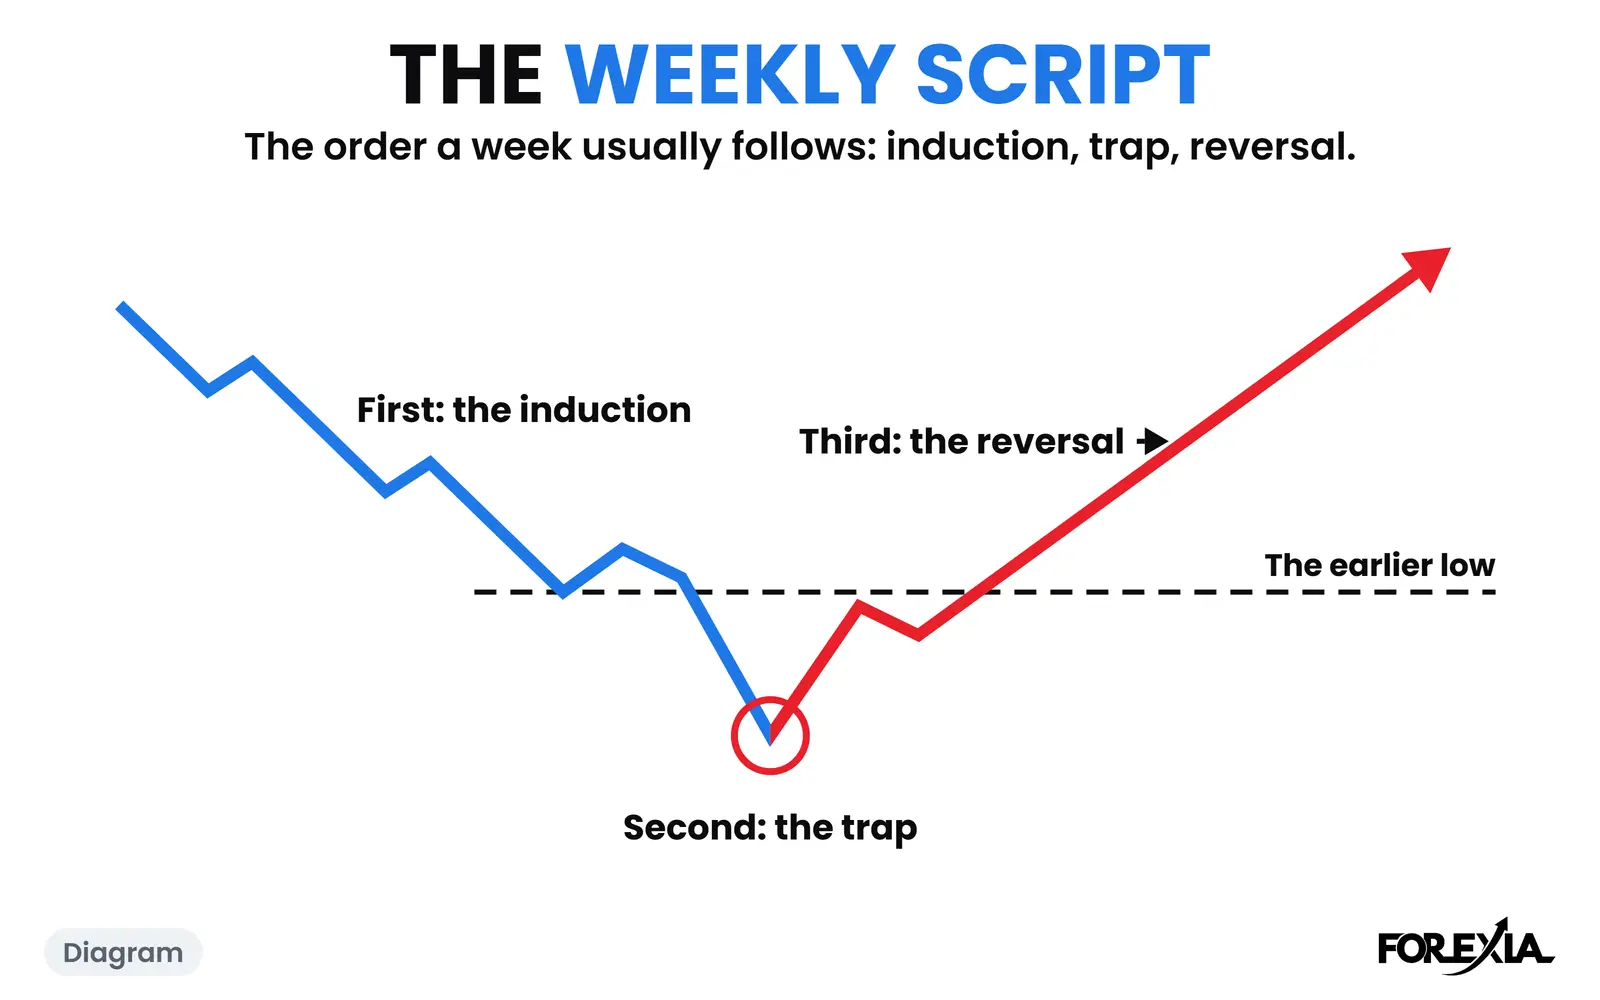
It also means the page can be wrong in a quiet way. A table of eight rows looks like a sample, and it is not one. We only draw a weekly chart when the week turned, and a week that trends into Friday leaves its far pool untouched. Weekly high and low liquidity shows one such week, on NZD/USD.
What can be counted about a week's high and low?
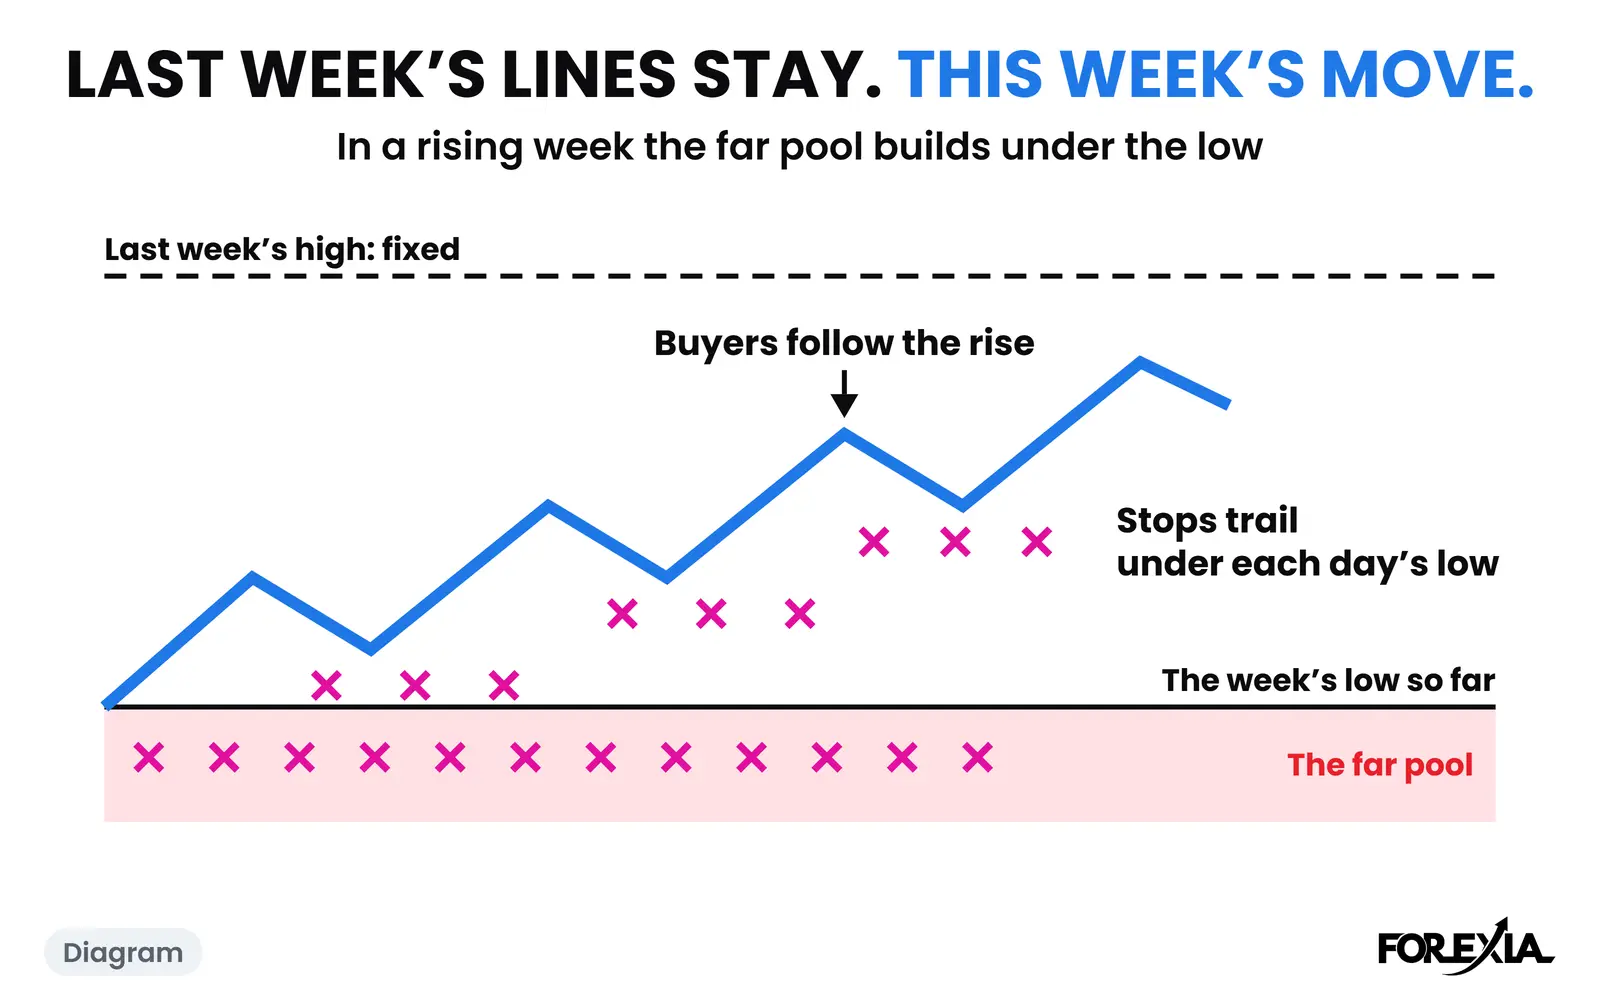
What a week does to last week's lines, because that has no weekday in it. Over 24 whole weeks from 13 April to 25 September 2026, on seven majors and gold, 177 of last week's highs and lows were traded through by at least 3% of the average day. The week still ended past the line on 100 of them. Both lines went in 20 of the 192 market-weeks, and neither went in 35.
So a weekly high or low is neither a wall nor a magnet, and no count here says which weekday makes one. If a rule of thumb names a day, ask for its sample, its dates and its market. Many come with none.
What do traders get wrong about the high of the week?
Three readings cost the most.
- Naming the high too early. The week's high is only known once the week has turned. Until then each is only the furthest price so far.
- Reading one week as a rule. Seven of eight in one session says something about that dollar move and nothing about Wednesdays in general.
- Reading the turn as a signal. A turn seen afterwards is not a setup, and our own test of the daily setup as a mechanical rule did not make money.
Sources
Every row is read from our week-of-31-August 2026 weekly-cycle chart write-ups, on Dukascopy candles in New York time. The jobs report is from the Bureau of Labor Statistics. The count of last week's lines is from scripts/seo-counts.mjs.
Course 4 of ForexiaPRO, The Week, in production, teaches this read in lesson 4.3.3.
For study only. This page is not a signal and not trade advice. Charts are Dukascopy candles, marked up after the fact.
Frequently asked questions
Which day is the weekly high in forex?
There is no fixed day, and this page gives no count of it. A week's high or low is only known once the week is over, or once it has clearly turned. In the week of 31 August 2026 seven of eight markets made their extreme in Wednesday's session and one made it earlier, and that is one week.
Is the weekly high usually made on Tuesday or Wednesday?
We make no claim about usual. Rules of thumb that name a weekday for the high or low often come with no sample, and even a good count would not tell you about this week. Our figures here describe one week of eight markets that moved on one dollar.
Why did eight markets turn together in the week of 31 August 2026?
They share a dollar. Seven of them are currency pairs quoted against it, and gold is priced in it, so the same move shows up on all of them. Eight turns on one dollar are closer to one event than eight.