Price Action Trading Without Indicators: One Real Day, Candle by Candle
Dylan Forexia6 min read
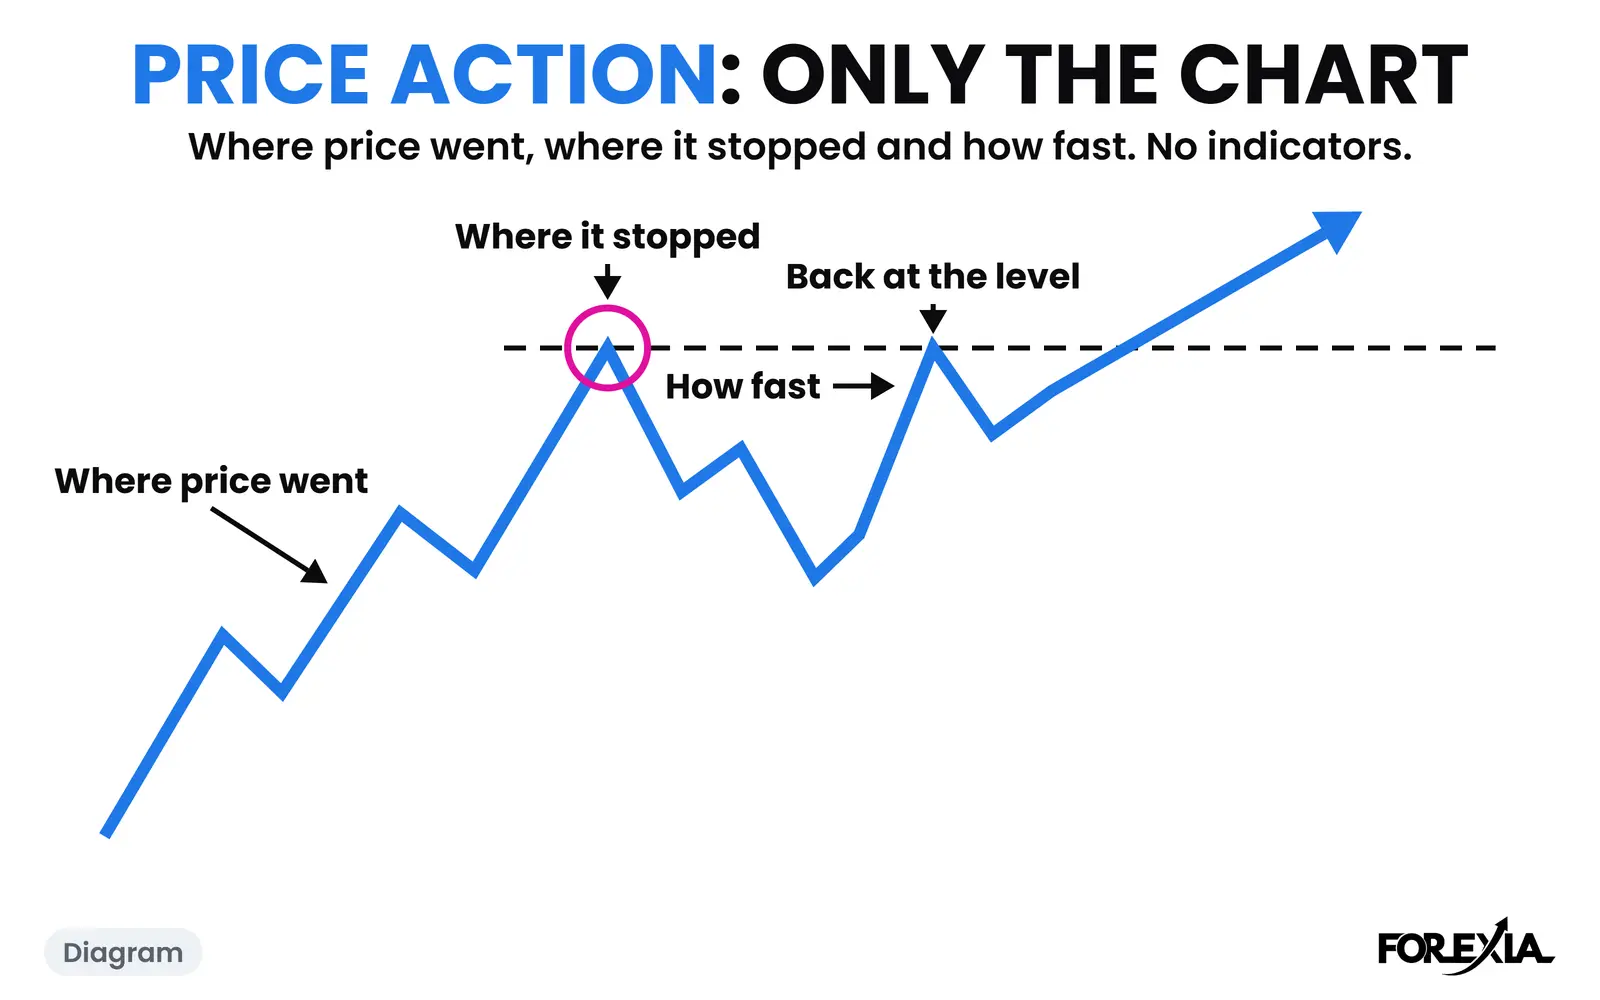
Price action trading without indicators means reading a chart from the candles alone: where price went, where it stopped and how fast. Nothing is drawn on it that the candles did not make. This page reads one real GBP/USD day that way, candle by candle, then says what an average would have added to it.
It is the practical page for the idea in our guide to price action. The day was picked because it reversed, so it shows a reading and not a result.
What is price action trading without indicators?
It is a chart with candles and a few horizontal lines, and nothing else. The lines are levels a crowd can see: the range Asia left, and the high and low of the last day. The clock matters too, because the London and New York opens are when those levels are reached. We do not use an average, an oscillator or volume.
An indicator is a calculation on past prices, so it cannot know anything the candles do not. That is the whole case for a naked chart, and also its limit: a naked chart knows only what price has done, never what it will. Reading is not a promise.
What does one real day look like without indicators?
GBP/USD on Wednesday 8 July 2026. These are Dukascopy 15-minute candles in New York time, so your broker's chart may differ by a pip or so.
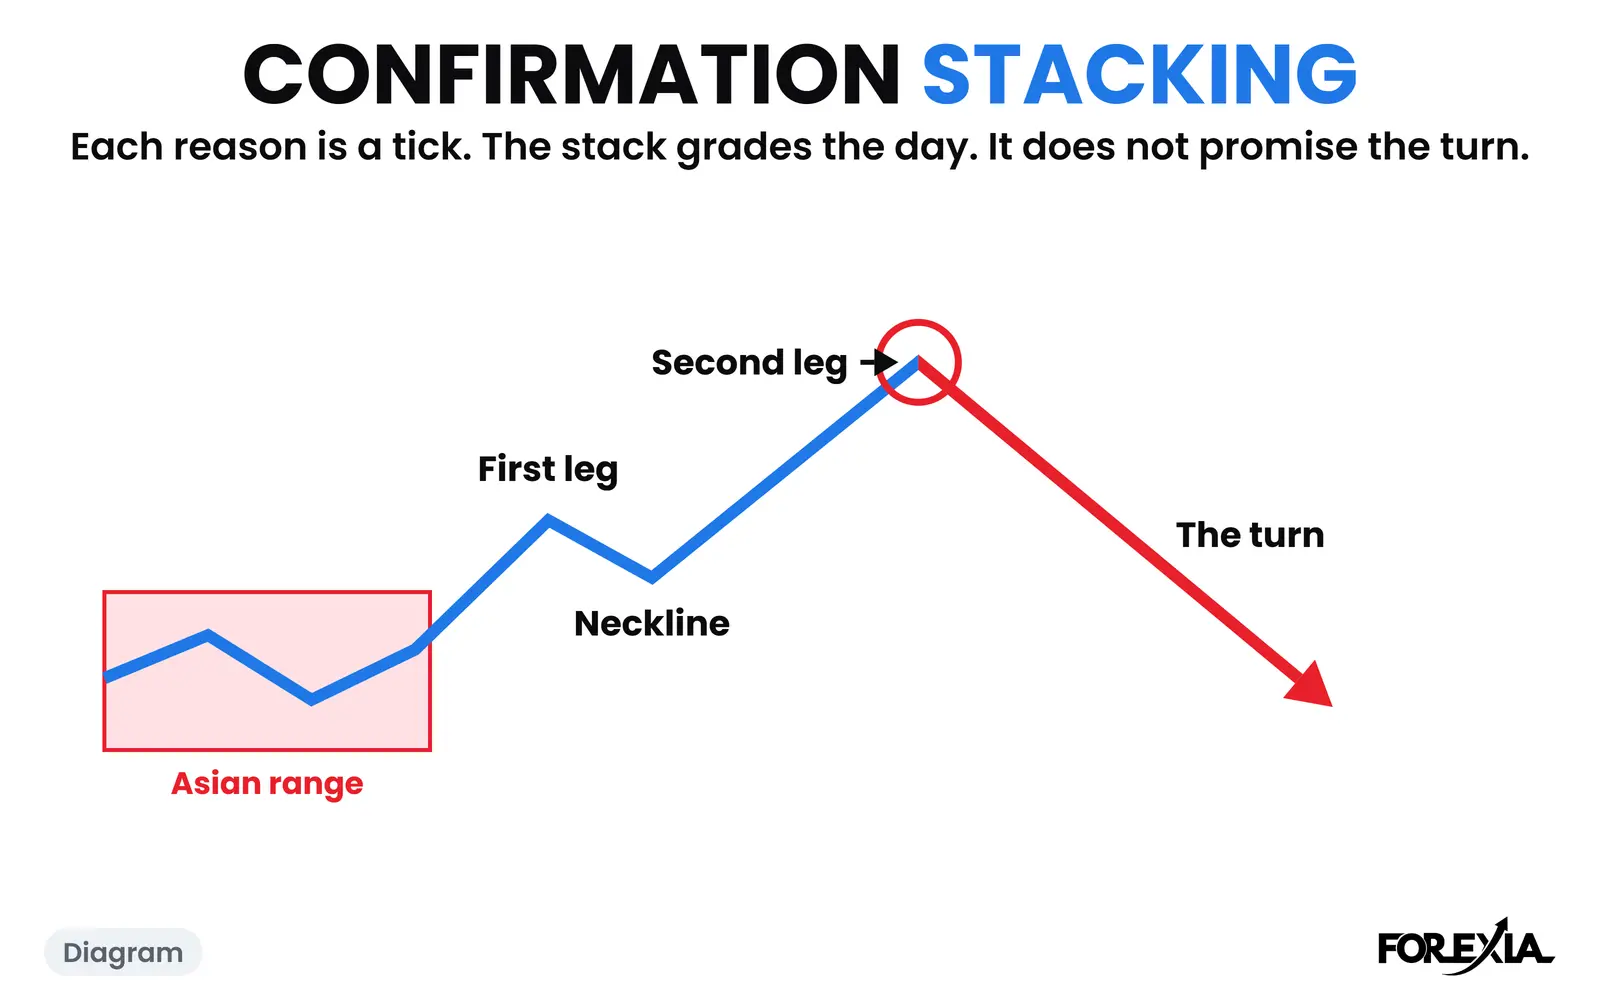
- Asia left a range. From the 17:00 session break to the London open it ran from 1.33420 to 1.33657, 24 pips, about 29% of the pair's average daily range. That is where a crowd would mark its levels, and it says nothing about direction.
- London broke the low. The 04:15 candle broke the Asian low, and the 04:30 candle reached 1.33386, 3 pips under it. Price pulled back to 1.33515. A crowd that sells a break like that has its stop above the range.
- A second push took the next stops. The 04:45 candle slipped just past that first low, and the 05:00 and 05:15 candles ran to 1.33219, 17 pips under it. That took the stops resting under the first low.
- The close back. The candle that opened at 05:30 closed back above the first low, at 1.33443. We read that as the sweep having happened. It is a reading, not a promise.
- The run. The 09:30 candle closed above the Asian high, at 1.33723, and price ran to 1.34101 at 13:15, 88 pips from the low. It turned out to be the low of the week.
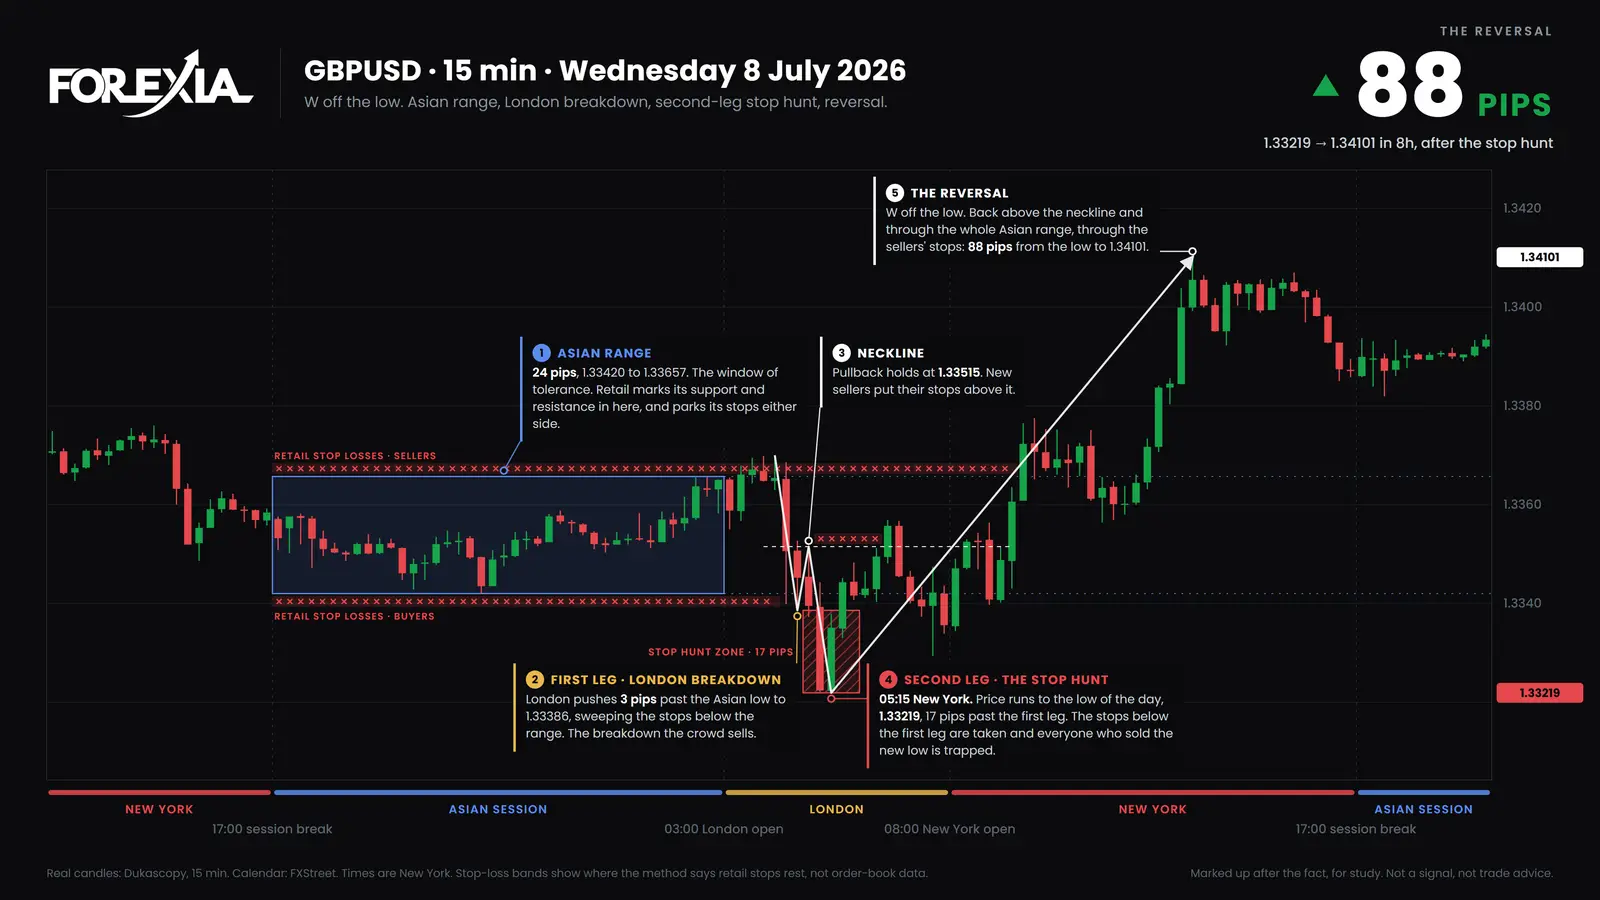
Nothing on that chart needs a calculation. The levels were visible by 03:00 and every one of the stops sat where a person would have put it. We picked this day because it reversed, and a day that did not reverse reads very differently. Our markup tool marks only days that turned, so our own archive is a folder of reversals and not a sample of ordinary days.
What would the same read have said on a day that did not turn?
The same four steps give a different answer, and the chart alone does not tell you in advance. On seven dollar majors and gold, from 6 April to 1 October 2026, a level (an edge of the Asian Box, or the previous day's high or low) was traded through by at least 3% of the average daily range 1,601 times. On 1,310 of them a candle closed back the same day, by a median of 9% of an average day past the level. On 291, 18%, nothing closed back by 17:00, and those ran a median of 65% of an average day past it.
A day like 8 July is the first kind and looks like the second kind until the close back prints. That is why this page says the reading is made after the candle closes, and why it says nothing about the next one. It is a count of candles, with no entry, stop or cost.
Who is on each side of that GBP/USD day?
We read three seats on it. The retail seat sold the break of the Asian low at 04:30 with a stop above the range. The market maker's seat saw those stops, and the stops under the first low, as the orders to fill. The observer's seat, ours, waits for the close back at 05:30 and describes it afterwards. That is our reading of the chart, and it cannot be proved from candles.
Why do indicators arrive late?
A moving average is an average of past prices, so a cross can only print after the move that caused it. We counted that on the same candles, using the 20 and 50 EMA on every 15-minute chart: 1,132 crosses from the London open to 17:00, on seven dollar majors and gold, from 6 April to 1 October 2026.
- The median cross came with 63% of the move already done. The middle half ran from 42% to 82%.
- 394 crosses came with at least three quarters of the move done.
- 444 crosses had crossed back before 17:00 the same day.
This says how late a cross came, not what to do at one. Our word for the crowd's version is The Trap: the averages cross late, pull the crowd in, then cross back onto their stops. Why moving average crossovers fail shows it on a USD/CHF day.
An average can still be a useful picture of a trend, or an alert. It only knows what the candles know.
What do you look at instead?
Four things, in the order the day above used them.
- The range the last session left. The Asian Box is the range from the 17:00 session break to the London open, and its two edges are where stops rest.
- The previous day's high and low. Yesterday's two extremes stay on the chart and carry orders past them.
- The clock. London and New York opens are where those levels tend to be reached, and a news release can be the second leg.
- The close. Whether a candle that went through a level closed back inside it, on the same candle or a later one, tells you whether it was a hunt or a break. A close back is not the end either: after a close back, a later candle traded past the wick again on 825 of 1,310 levels in our count.
None of that is a rule for entering. It is the order in which we look, and the course teaches the rest. Reverse price action is our name for reading the chart from where the stops were.
Does price action trading without indicators work?
As a way to read a chart, yes. As a fixed rule, the version we tested lost money. We ran the setup with no judgement on seven dollar majors and gold from 2021 to 2026, on 5-minute candles, with real spreads plus commission and slippage. Every year lost, between -0.10R and -0.23R a trade, where R is the amount risked on one trade. That does not show that a person reading the chart loses, or wins: it is one rule we wrote on past prices. The figures and limits are in the backtest.
What do traders get wrong about a naked chart?
Three readings cost the most.
- Thinking the clean chart is the edge. Removing the indicators removes noise, not risk. The stops are where they were.
- Learning from picked days. Every chart here was chosen after the move, ours included. Keep a log of every setup you take or skip: that is the only record that shows whether your reading is worth anything.
- Calling a reversal afterwards a trade. A reversal seen afterwards is not a setup.
Course 3 of ForexiaPRO, Reverse Price Action, teaches this read step by step, from lesson 3.1.1. It is on ForexiaPRO.
Tools for this
Frequently asked questions
Can you trade price action without indicators?
You can read a chart without them. An indicator is worked out from prices that have already traded, so everything it knows is on the candles. We read the Asian range, the previous day's high and low, the clock and the news calendar, and we draw no averages. Whether a reading pays is another question: our own fixed-rule test of this setup lost money.
Why do indicators arrive late?
Because they are made of past prices. In our count of 1,132 crosses of the 20 and 50 EMA on 15-minute candles from the London open to 17:00, from 6 April to 1 October 2026, the median cross came with 63% of the move already done. 444 of the 1,132 had crossed back before 17:00 the same day.
What does a price action trader look at instead?
Where price went, where it stopped and how fast. In practice that is the session ranges, the high and low of the last day, the candle that went through them, and the clock. The page walks one real day, GBP/USD on 8 July 2026, to show what that looks like, and says the day was chosen because it reversed.