Which Way Does a Rising Wedge Break? A Count of 184 on 15-Minute Candles
Dylan Forexia6 min read
Which way does a rising wedge break? On 15-minute candles, down, far more often than up: of 184 rising wedges on seven dollar majors and gold, 140 broke down, 39 broke up and 5 did not break. Most of that is geometry, not a market falling, and it shows when you ask what price had done by the time the line gave way.
A rising wedge is two rising lines that converge, with the lower line steeper. Guides read it as bearish. This page counts what the break did on our candles and says how little the count proves. The same numbers sit in our guide to price action, and the wedge also opens the setup we call the #SignatureTrade.
What did we count, and by what rule?
A wedge here is a shape a program can find, so it is stricter and more mechanical than one drawn by eye. The rule is fixed and was written before the results.
- The shape. Three rising pivot highs and three rising pivot lows that overlap in time. The top line runs through the first and third high, the bottom line through the first and third low. The bottom line must be steeper.
- The size. The wedge is at least 15% of the average daily range wide where it starts, and every close in between sits inside the lines, with the middle pivots inside by 10% of that width.
- The break. The first close outside a line, from the fourth candle after the last pivot, for as many candles as the wedge took to form or until the lines meet.
- The sample. Every 15-minute candle from 6 April to 1 October 2026, on seven dollar majors and gold: 1,030 market-days, Dukascopy candles, New York time. A falling wedge is the mirror.
It counts candles. There is no entry, no stop, no cost and no trade in it, and nobody looked at a chart to pick a wedge.
Which way does a rising wedge break in our count?
Mostly the way the books say. The table gives every wedge the rule found, split by what its first close outside a line did.
| Shapes | Broke down | Broke up | No break | |
|---|---|---|---|---|
| Rising wedge | 184 | 140 | 39 | 5 |
| Falling wedge | 153 | 22 | 128 | 3 |
So the textbook has the direction right on this sample. A rising wedge broke down 140 times in 184, and a falling wedge broke up 128 times in 153. That is about three in four for the rising wedge and five in six for the falling one. One published figure, Thomas Bulkowski's, from more than 1,400 trades in bull markets, has 60% breaking down. It was measured on other charts with other rules, so neither figure is a law.
The shapes were not spread evenly. Rising wedges were most common on the yen (35), the Canadian dollar (31), the Swiss franc (30) and gold (25), and least common on the pound (12) and the euro (14). Falling wedges outnumbered rising ones on the euro (27 against 14), and on the yen it was the reverse by a wide margin (6 against 35). Eight markets over 25 weeks is a small sample for any of those gaps.
Why does it usually break down? The lines, not the market
The lower line is steeper than the upper one, so the two lines are always closing on each other. Price that does nothing is carried out of the bottom by a line that keeps rising. That is not selling. It is the line catching up.
Our count shows how much of it that was.
- Few had fallen. Of the 140 breaks down, only 16 had closed under the wedge's last low when the line broke. In the other 124, price was still above that low and the line had come to it.
- Falling wedges look the same. Of the 128 that broke up, 15 had closed over the wedge's last high.
A close under a rising wedge's lower line is therefore usually not a market that has started to fall. That matters because most guides read the line break as the signal and place a stop above the wedge.
What happened after the break?
From the next candle, for up to 96 candles (a trading day), we asked which came first: price trading back past the far side of the wedge (its highest high), or price travelling the wedge's starting width in the direction of the break. A candle that did both counts as the first.
| After a break in the book's direction | Back past the far side first | The wedge's width first | Neither |
|---|---|---|---|
| Rising wedge, 140 broke down | 94 | 38 | 8 |
| Falling wedge, 128 broke up | 88 | 35 | 5 |
The race is tilted. By the time a wedge breaks its far side is close and its starting width is a long way off. We report it as a description. It says that a line break is not, on its own, a market going the way the book says. It does not say what a trade would earn, and our own test of a related setup as a mechanical rule did not make money (the backtest).
A real wedge: gold on 14 April 2026
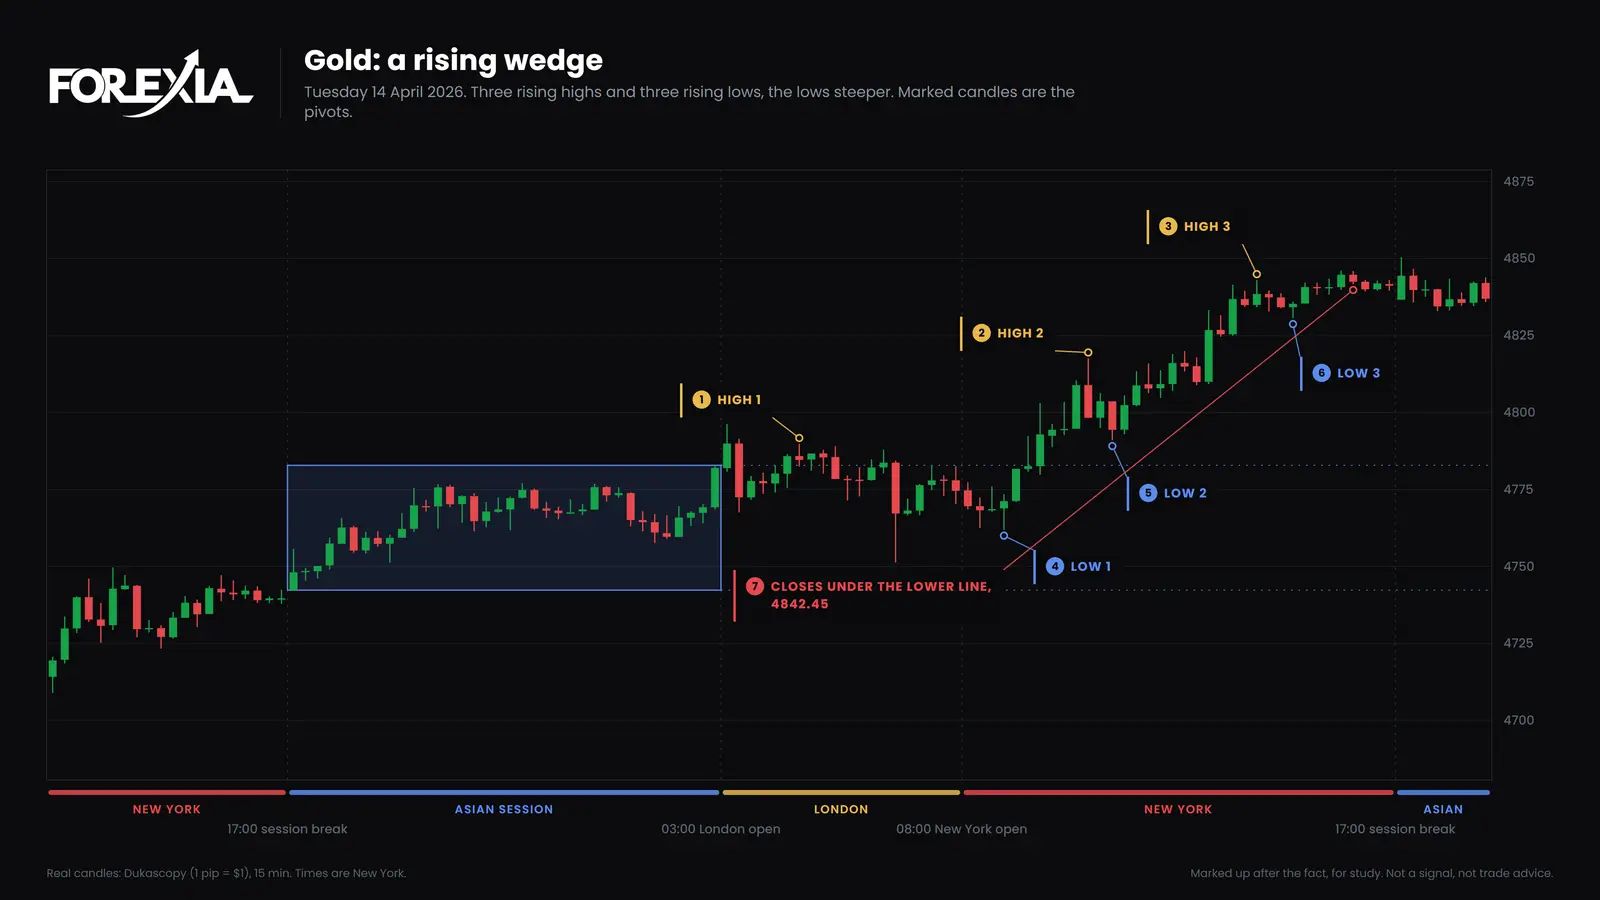
Gold made three rising highs on Tuesday 14 April 2026, at 4789.82, 4817.60 and 4843.02. Its lows rose too, at 4761.90, 4790.99 and 4830.61, and the lower line was the steeper. The 16:00 New York candle closed at 4842.45, under that line and still 12 pips above the last low. On gold we count $1 as 1 pip.
The chart above shows it. Price did not fall. Anyone who sold the break had a stop over the high, and price took it, running to 4871.16. This is one day we picked because it shows the point, so it proves nothing by itself: the table is the evidence. A line break that came with no fall is the common kind, 124 of 140.
Who is on each side of a wedge break?
We read a rising wedge from three seats. The retail seat sees a pattern the books call bearish and sells the line, with a stop above the high. The market maker's seat sees that stop above the high, in a place everyone can see. The observer's seat, ours, sees a break that comes with no fall in most cases and asks where the orders are. That is a reading, not something a chart can prove.
It is also where the #SignatureTrade starts. Our setup wants a wedge on day one, then a clear range on day two, and a break of the previous day's high. We read the break as the point where the crowd believes the trend will continue. Why order matters in wedge pattern trading goes through the sequence.
What does this count not say?
It says nothing about trades, costs or what a person drawing wedges by eye would find. Read it with these limits.
- It is a rule, not an eye. A trader draws wedges the rule would not, and the rule finds some a trader would not draw.
- It is 25 weeks and four days. The sample is short, and all of it sits inside one setting of the clocks.
- The window was a day. The race was limited to 96 candles, and a longer window would give other numbers.
- It is not a result. No entry, stop or cost is in it. Reading a count of breaks as a measure of profit is the mistake.
A wedge is judged by eye in the course, never forced, and the count above is a check on the textbook, not a trading rule. For the pairing the textbook leaves out, see rising wedge vs falling wedge.
Course 3 of ForexiaPRO, Reverse Price Action, teaches how to read a pattern from the stops it leaves, step by step. It is on ForexiaPRO.
Tools for this
Frequently asked questions
Does a rising wedge always break down?
No. In our count of 184 rising wedges on 15-minute candles of seven dollar majors and gold, from 6 April to 1 October 2026, 140 broke down, 39 broke up and 5 never broke inside the window we gave them. The book's direction is the common one, not the only one.
Why does a rising wedge usually break down?
Mostly because of its shape. The lower line is steeper than the upper, so a market that only drifts sideways falls out of the bottom as the line rises to meet it. Of our 140 breaks down, only 16 had closed under the wedge's last low when the line broke, so in most of them price had not fallen: the line had caught up with it.
What happens after a rising wedge breaks down?
In our count, 94 of the 140 traded back past the wedge's high before they travelled the wedge's starting width, and 38 travelled that width first. That is a count of candles, with no entry, stop or cost, and it is not a measure of a trade.