
The #SignatureTrade: a Wedge, a Clear Asian Range and the Break Everyone Believes
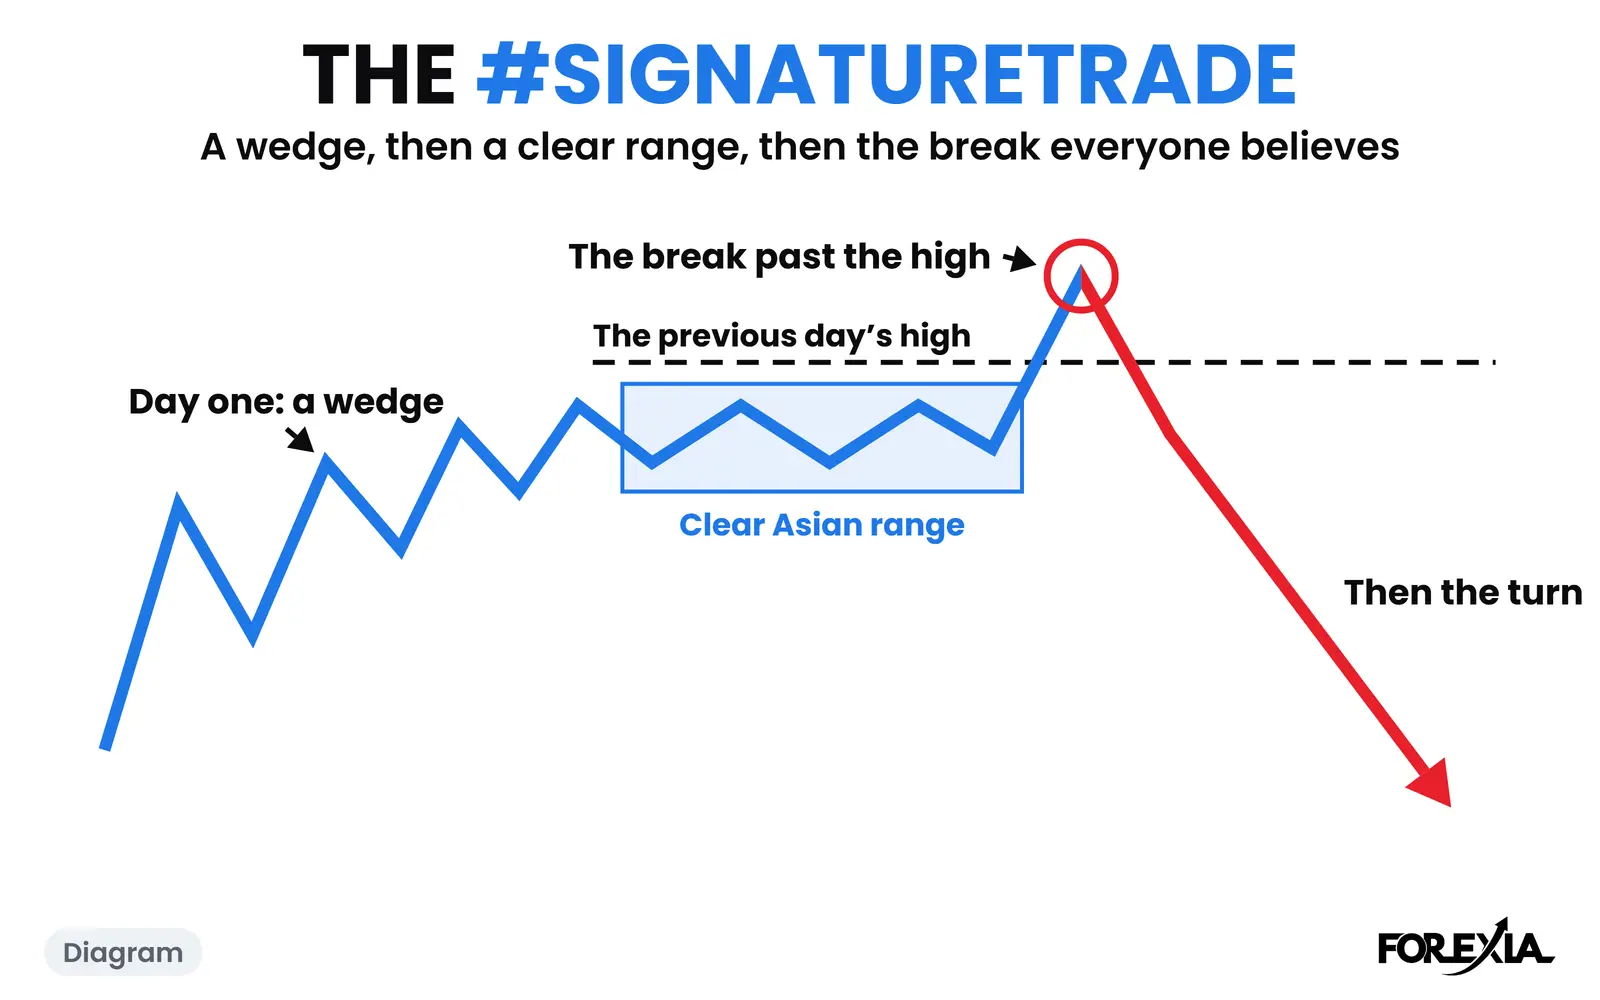
#SignatureTrade is a setup that runs over two days, the one the signature trade forex guide is built on. Day one shows a wedge. Day two shows a clear Asian range. The window opens when price breaks the wedge and the previous day's high, usually at the London open. It is Forexia's name for a setup that many traders know as a rising wedge pattern, with two more conditions around it.
What does the #SignatureTrade look like on a chart?
It looks like three things arriving in order. A wedge forms on day one: price narrows between two converging lines. The Asian range on day two is easy to see. Then price goes through the wedge and through the previous day's high, which is where the stop hunt shows itself. A rising wedge into a high is the sell version. A falling wedge into a low is the buy version.
We read the break as the point where the crowd believes the trend will continue. Its orders and stops sit at levels everyone can see. The course's words for it are "enter at the peak, when everyone believes the trend will continue". On this page, that is a description of where we look, not a rule for what to do.
A real day: USDCAD on 6 August 2026
We show this one because it is honest about the first condition. It is the mirror image: the level is the previous day's low, not a high.
Day one, Wednesday 5 August, was a sell-off to a low of 1.40045 at 14:15, then a narrow drift at the low.
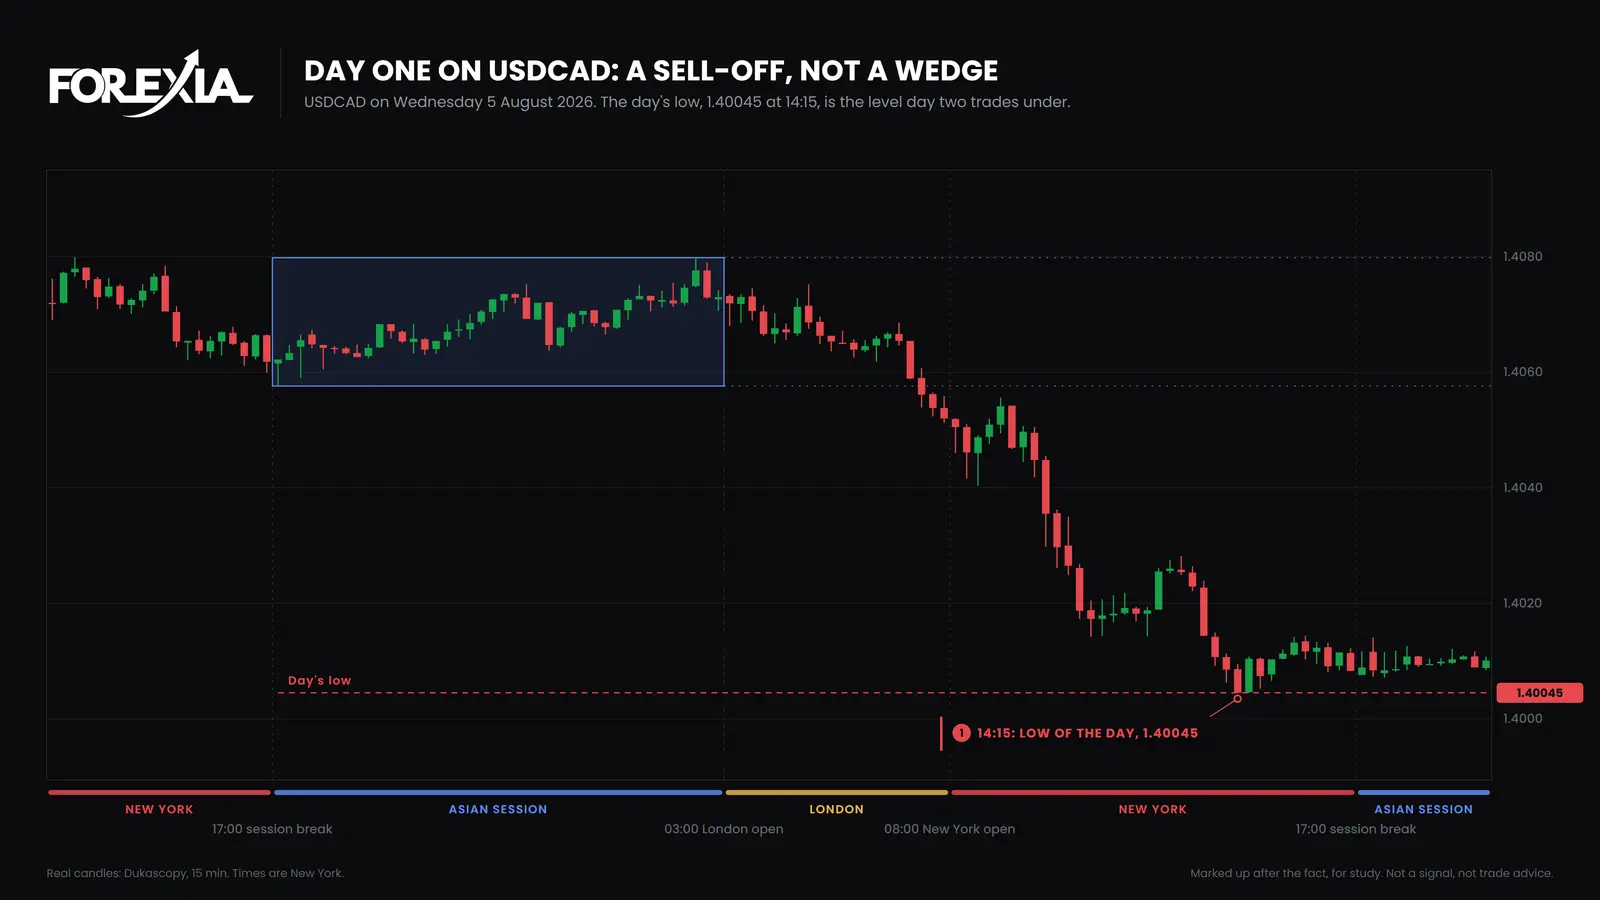
We do not call that a wedge. We cannot draw two lines that converge around it, and the shape is never forced. By the owner's own rule this day is therefore not a #SignatureTrade. It still shows what the window looks like.
Day two, Thursday 6 August, had a 15-pip Asian range from 1.40022 to 1.40172, and it was easy to see. The range had already dipped 2 pips under Wednesday's low at 21:15. The first London-session candle to trade under 1.40045 was the one at 06:15, which reached 1.40028. Price went on to 1.39901 at 08:00, the New York open. The 08:45 candle closed back over the low at 1.40065, and price reached 1.40375 at 11:30.
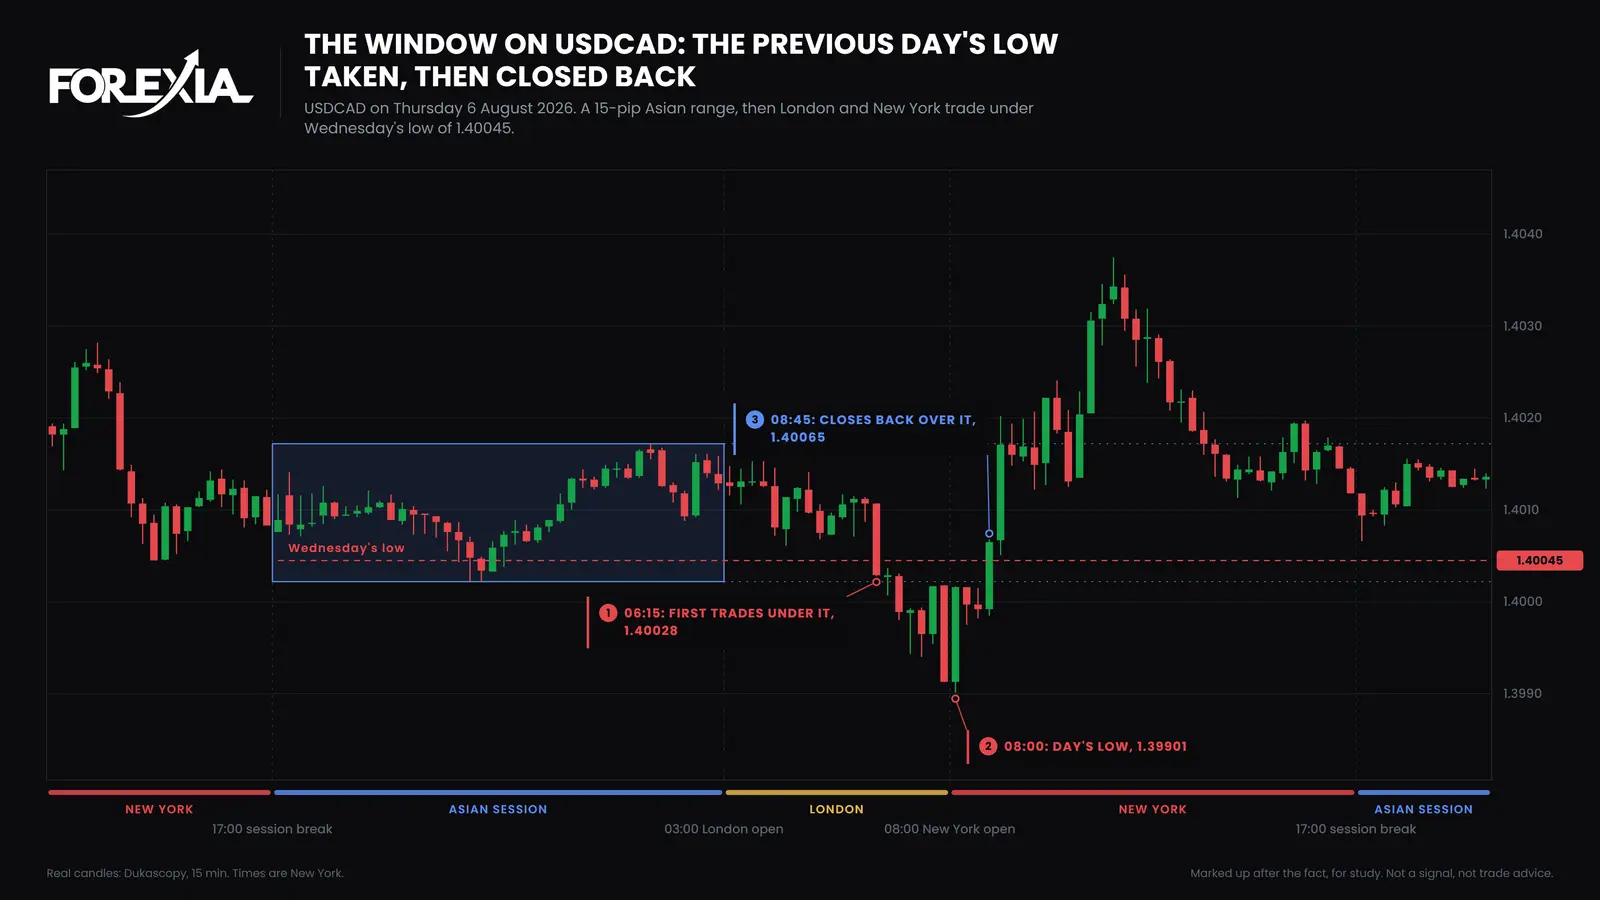
Medium-impact US releases came at 08:30 (jobless claims, productivity and unit labor costs). The 08:30 candle was quiet, 1.39982 to 1.40015, and the turn came on the next one. There was no high-impact release. We read the move under the low as the stops under it being filled, and the move back as what that funded.
The #SignatureTrade and the rising wedge pattern: how do they differ?
The rising wedge pattern is one shape, and guides read it as bearish. It makes no claim about the day before the break or the range after it. The #SignatureTrade is three conditions, and the wedge is the first. Every wedge counts, and so does a triangle or anything of that family, but only if it looks like one. It is looked for mostly on the 15-minute and 1-hour charts. The owner has set no minimum number of touches and no length, and this page does not invent one.
The wedge also answers a different question. A guide asks whether the pattern breaks down. We ask who has been invited in by a break that looks like a continuation. That is the "induction": an invitation to follow the trend, made at a level where the orders are waiting. The same idea sits behind the Window of Opportunity, the break of the previous day's extreme. It is strongest after three days of the Induction Trend.
How do you tell it from a plain wedge?
Check the three in order, on the day itself. Is there a wedge you would draw without effort? Is the Asian range on the next day obvious, the more consolidated the better? Does the break go through both the wedge and the previous day's high or low? The entries cluster in the hour and a half either side of the London open and the New York open. London is the usual place, not the only one. A break in New York counts.
If the wedge is not clear, or the range is not obvious, it is not a #SignatureTrade. That includes the day above.
What do traders get wrong about it?
Three readings cost the most.
- Forcing the wedge. A shape drawn to fit is not a wedge. The sell-off on 5 August would take a lot of drawing.
- Taking it for a promise. Our own test of the setup as a mechanical rule did not make money. A turn after a break is not a setup, and the name does not say the break will turn.
- Reading one candle. The first trade past a level is not the furthest point. On 6 August the first trade under the low was 06:15 and the extreme came at 08:00.
Which words does the #SignatureTrade lead into?
Four sit next to it.
- The Window of Opportunity: the break past the previous day's extreme, usually at the London open.
- Confirmation Stacking: how many things line up on a day.
- Previous Day's High and Low: the level the break goes through.
- The Asian Box: the range on day two.
The hub for the whole setup is the #SignatureTrade.
Where is the #SignatureTrade taught?
Course 5 of ForexiaPRO, The #SignatureTrade, in production, teaches this read in lesson 5.1.1, What the #SignatureTrade is.
Related words
- The Window of Opportunity: When the Signature Trade's Entries Cluster Around the London and New York Open
- Confirmation Stacking: How Many Confirmations Does a Forex Setup Need?
- The Previous Day's High and Low: What Rests There, and How Often Price Closes Back
- Reverse Price Action: Reading a Pattern Backwards, and What a Fake Breakout Really Is
- The Midweek Trap: A Multi-Day M on One Real Week, Read Candle by Candle
Frequently asked questions
What is the #SignatureTrade?
It is Forexia's name for a setup that runs over two days. Day one shows a wedge. Day two shows a clear Asian range. The window opens when price breaks the wedge and the previous day's high, usually at the London open, and we read that break as the crowd's belief that the trend will continue. If the wedge or the range is not obvious, it is not a #SignatureTrade.
Is a rising wedge the same as the #SignatureTrade?
No. A rising wedge is one shape, and the textbook reads it as bearish. The #SignatureTrade needs that shape on day one, then a clear Asian range on day two, then a break of the previous day's high. It is also found in mirror image: a falling wedge into a previous day's low.
Does the wedge have to be a rising wedge?
No. A rising or falling wedge counts, and so does a triangle or anything of that family, but the shape has to be there. We never force it: if it does not look like a wedge or a triangle, it is not one.
Does the #SignatureTrade make money?
We tested the setup as a mechanical rule, with fixed conditions, and it did not make money. The name describes a pattern in the chart and who is on each side of it. It is not a promise that the break turns.