Rising Wedge vs Falling Wedge vs Ascending Triangle: Same Lines, Counted
Dylan Forexia6 min read
Rising wedge vs falling wedge is a question about one shape and its mirror. Both are two lines that converge. A rising wedge slopes up with the lower line steeper, and the book reads it as bearish. A falling wedge slopes down with the upper line steeper, and the book reads it as bullish. An ascending triangle looks close to a rising wedge and is not the same shape.
This page sets the three side by side, then counts the two wedges on real candles. The break direction has its own page. Our guide to price action has the rest of the patterns.
How are a rising wedge and a falling wedge different?
By the way both lines slope, and what the book says follows from it. The two are reflections of each other: turn a rising wedge upside down and you have a falling wedge, with every line, break and stop on the other side.
- Rising wedge. Both lines rise, the lower one faster, so they close on each other. Read as bearish: a break of the lower line is the signal and the stop goes above the high.
- Falling wedge. Both lines fall, the upper one faster, so they close on each other. Read as bullish: a break of the upper line is the signal and the stop goes under the low.
Falling volume is the other thing guides add, and it is said to go with both shapes. Forex has no central volume figure, so we do not use it. Most guides stop there. The part they leave out is that the faster line is also the line price falls out of when it simply goes sideways, so each wedge breaks the book's way for a reason that is not about direction. The count below says how much of the book's direction that explains.
How do a wedge and an ascending triangle differ?
A wedge has two sloping lines. An ascending triangle has one flat line, the top, and a rising line under it that meets it. The upper edge of a rising wedge rises, and the top of an ascending triangle does not.
That makes the stops different. Under a triangle's flat top, a row of buy orders and sellers' stops sits on one price, which anyone can see. A wedge offers no single price: its stops sit above the last high and under the last low. The two shapes are not interchangeable even when they look alike on a small chart.
We have not counted ascending triangles. Our wedge rule needs both lines to slope the same way, so a triangle does not qualify, and we give no figure for how a triangle breaks. A page that does should show its rule.
What did 337 wedges do on 15-minute candles?
We counted on seven dollar majors and gold, from 6 April to 1 October 2026, on Dukascopy 15-minute candles: 1,030 market-days. The rule needs three rising (or falling) pivot highs and lows that overlap in time, a steeper lower (or upper) line, a width of at least 15% of the average daily range, and every close inside the lines. The break is the first close outside a line.
| Shapes | Broke down | Broke up | No break | |
|---|---|---|---|---|
| Rising wedge | 184 | 140 | 39 | 5 |
| Falling wedge | 153 | 22 | 128 | 3 |
The book had the direction right on both sides, about three in four for the rising wedge and five in six for the falling one. A falling wedge was a little more reliable in direction in our sample. Eight markets over 25 weeks and four days cannot say whether that gap is real.
Does a falling wedge behave like a rising wedge in reverse?
Close to it. We asked how much of the move was there when the line broke, and what came next.
- Price had mostly not moved. Of the 140 rising wedges that broke down, 16 had closed under the last low. Of the 128 falling wedges that broke up, 15 had closed over the last high. In the rest, the steeper line had caught price.
- Many went straight back. After the break, 94 of the 140 rising wedges traded back past the wedge's high before they travelled the wedge's starting width. For the falling wedge it was 88 of 128. The wedge's width came first in 38 and 35.
The shapes are therefore two versions of one thing: a line break that usually arrives with no move behind it, then a run back past the far side. These are counts of candles, with no entry, stop or cost, and not trades.
Which markets make which wedge?
Not evenly, and with a small sample the differences are suggestive only.
- Rising wedges. The yen (35), the Canadian dollar (31), the Swiss franc (30) and gold (25) had most. The pound had 12 and the euro 14.
- Falling wedges. Gold (28), the euro (27), the Canadian dollar (25) and the Australian dollar (22) led. The yen had 6.
The yen's 35 to 6 is the widest split. We do not know why, and we would not build a rule on it.
What does a real rising wedge look like?
Gold made one on Tuesday 14 April 2026. Its highs were 4789.82, 4817.60 and 4843.02 and its lows 4761.90, 4790.99 and 4830.61, so both lines rose and the lower one rose faster. The 16:00 New York candle closed at 4842.45, under the lower line and still 12 pips above its last low. Price went on to 4871.16 and took the stop above the high.
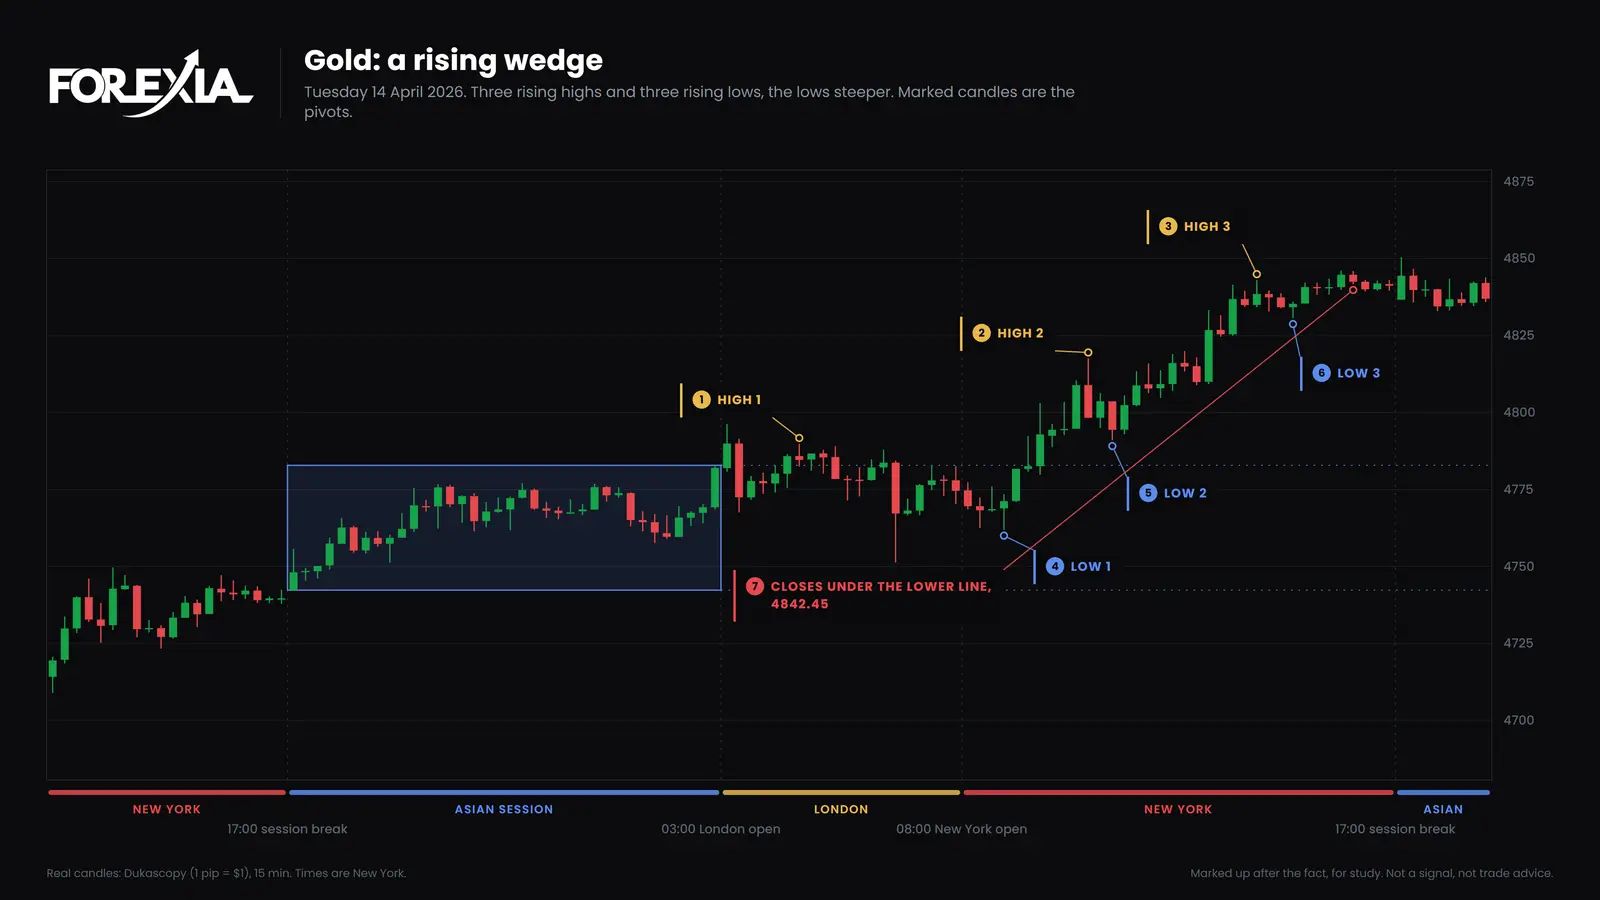
We show a rising wedge because it is the one on our site with prices. There is no dated falling wedge on the site yet. We picked this day for what it shows, so it is an illustration, and the count above is the evidence.
Where does the wedge sit in the #SignatureTrade?
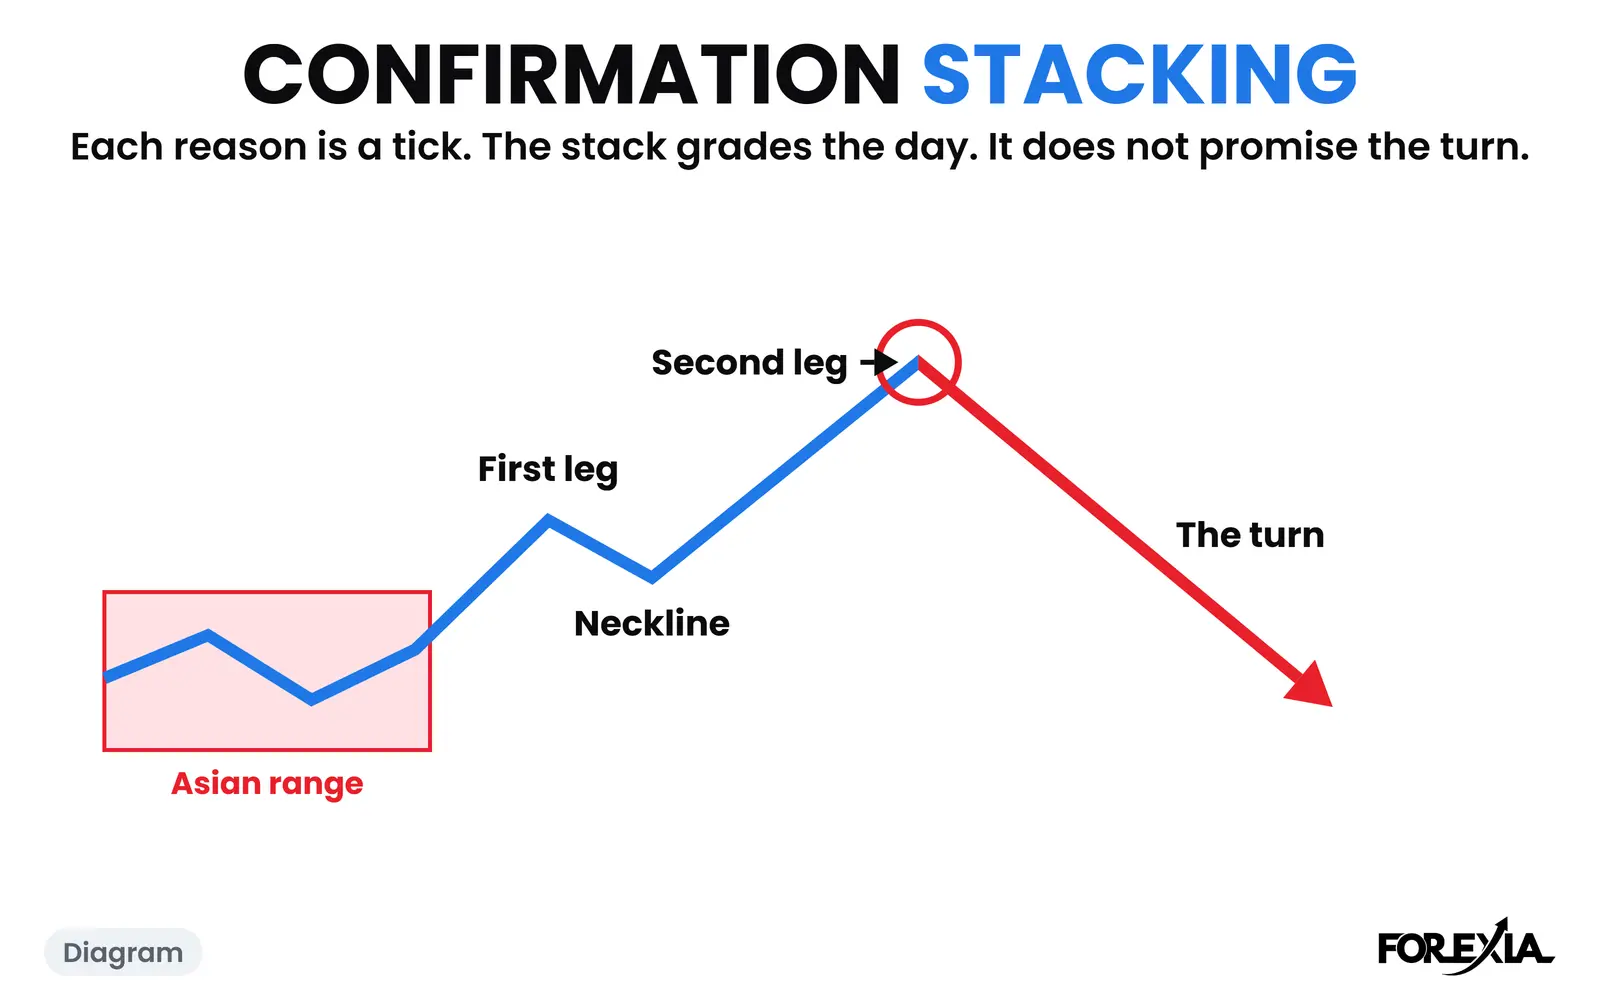
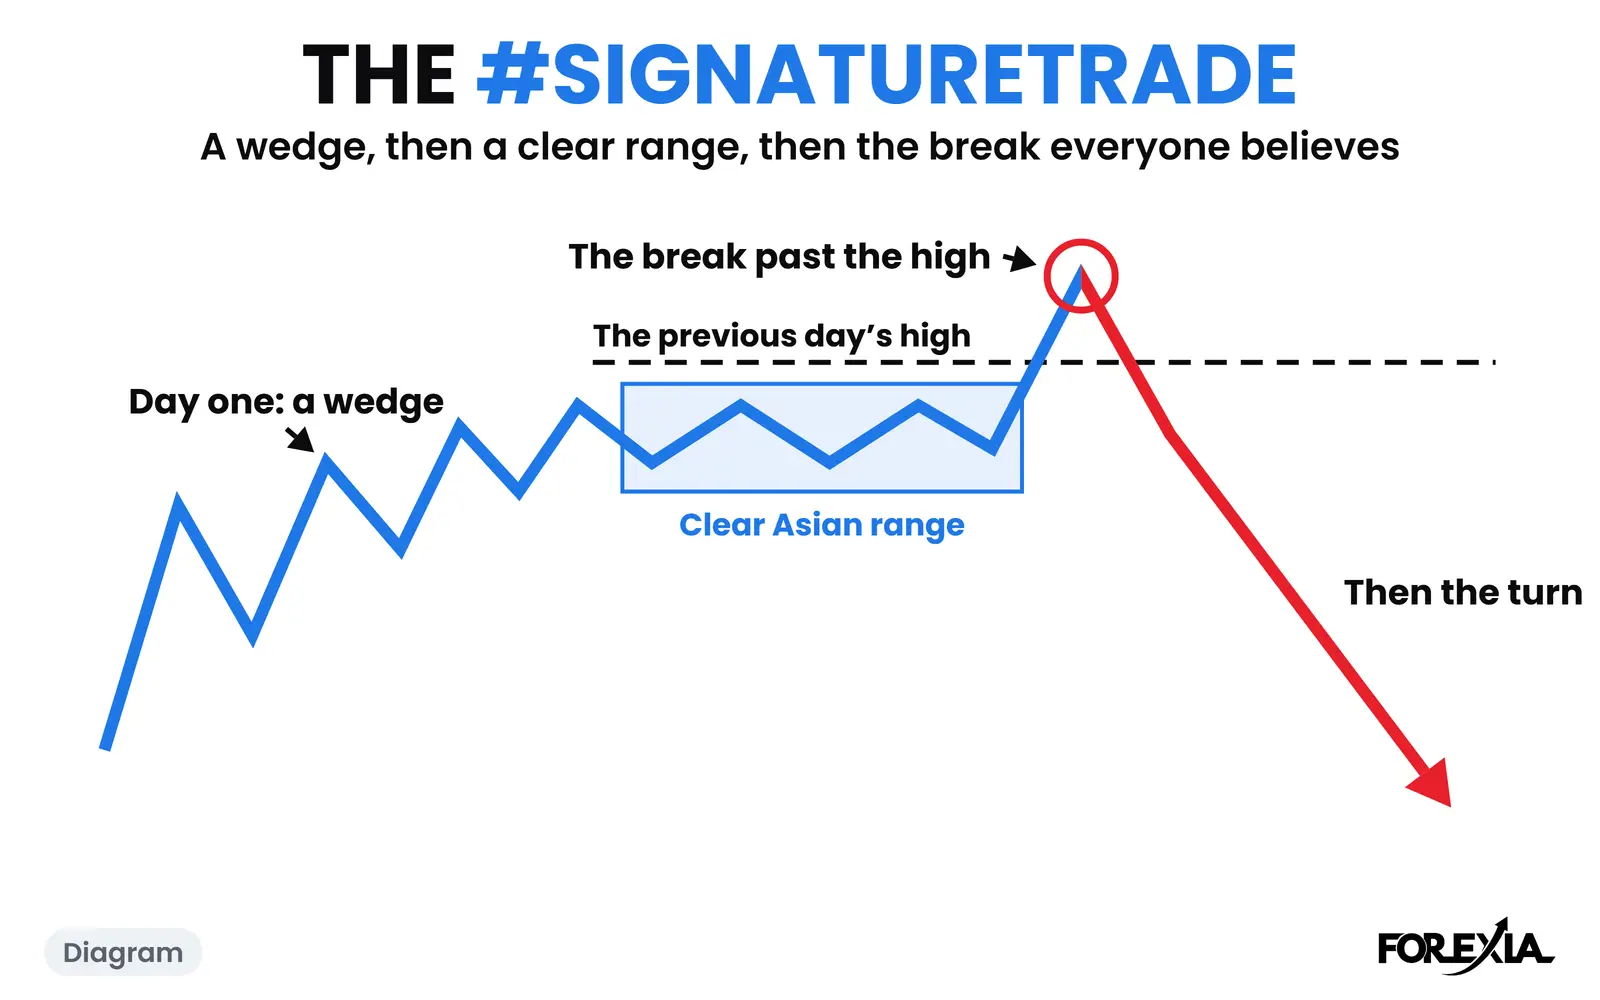
A wedge is the first of three conditions in our setup, and either wedge counts. A rising wedge into the previous day's high is the sell version. A falling wedge into the previous day's low is the buy version. The course judges the shape by eye, mostly on the 15-minute and 1-hour charts, and never forces it. Anything that is not clearly a wedge or a triangle is not one. The sequence, with the range and the window after it, is in wedge pattern trading, and the definition is in the #SignatureTrade glossary page.
Our own test of the setup run as a mechanical rule did not make money, and a rising wedge that broke down is not a setup afterwards, however clean it looks.
What do traders get wrong about the two wedges?
Three readings cost the most.
- Reading the name as the direction. The book's break was the common one, not the only one: 39 rising wedges broke up and 22 falling wedges broke down.
- Mixing a wedge and a triangle. One flat line makes a triangle, with a different row of stops.
- Reading a flag or a channel as a wedge. A wedge's lines converge. Two lines that stay parallel make a channel, and a short drift against the trend makes a flag. Neither has the wedge's built-in tilt toward one side, so a count of wedges says nothing about them.
- Treating the break as the move. In most of our breaks price had not yet moved. A close outside the line is where the line caught up, and it is not the same as the market turning.
Course 5 of ForexiaPRO, The #SignatureTrade, teaches how the wedge fits the setup in lesson 5.1.2. It is on ForexiaPRO.
Tools for this
Frequently asked questions
What is the difference between a rising wedge and a falling wedge?
They are mirror images. A rising wedge has two rising lines that converge, with the lower line steeper, and the book reads it as bearish. A falling wedge has two falling lines that converge, with the upper line steeper, and the book reads it as bullish. On our 15-minute count, 140 of 184 rising wedges broke down and 128 of 153 falling wedges broke up.
What is the difference between a wedge and an ascending triangle?
In an ascending triangle one line is flat, the top, and the lower line rises to meet it. In a wedge both lines slope the same way and converge. A rising wedge is not an ascending triangle with a longer lower line: the upper line of a wedge rises as well. We have not counted triangles, so we give no figure for them.
Is a falling wedge always bullish?
No. Of our 153 falling wedges, 128 broke up, 22 broke down and 3 did not break. Of the 128 that broke up, 88 traded back past the wedge's low before they travelled the wedge's starting width. A direction is not a trade.