Reversal Candlestick Patterns: Six Shapes, Their Stops, and What a Shape Does Not Prove
Dylan Forexia10 min read
Reversal candlestick patterns are named shapes of one to three candles that books say show a trend running out: the hammer, the shooting star, the engulfing candle, the morning and evening star, the doji and the piercing line. Each one describes how the candles look. None of them says why price turned, and on real days the same shape ends two ways.
In brief
- What they are: six shapes, three bullish and three bearish in kind, each read after a fall or a rise.
- What they ask for: a confirming candle, and a stop just past the pattern's far end.
- Which is strongest: we have no test that ranks them, so we do not.
- What we add: a hammer's shape on two release-day candles, one that held the day's low and one that held its high.
What are the main reversal candlestick patterns?
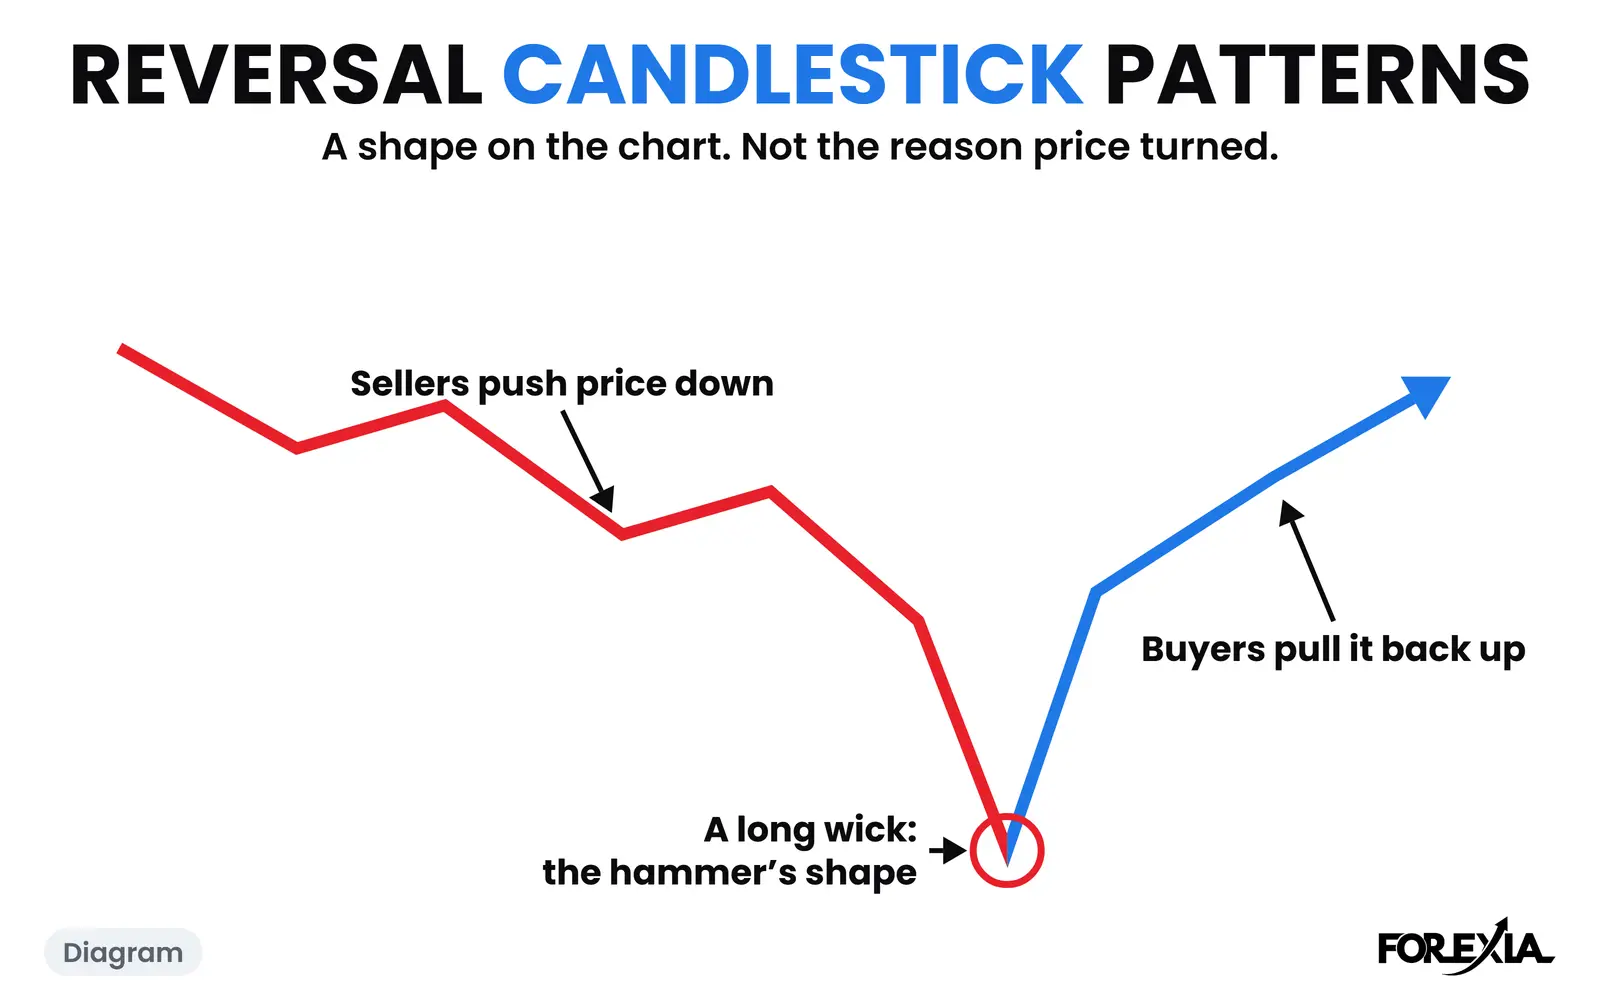
Six turn up in every guide. The drawings below are drawings of what each shape looks like. They carry no price and no date, and they are not real candles.
The hammer and the shooting star
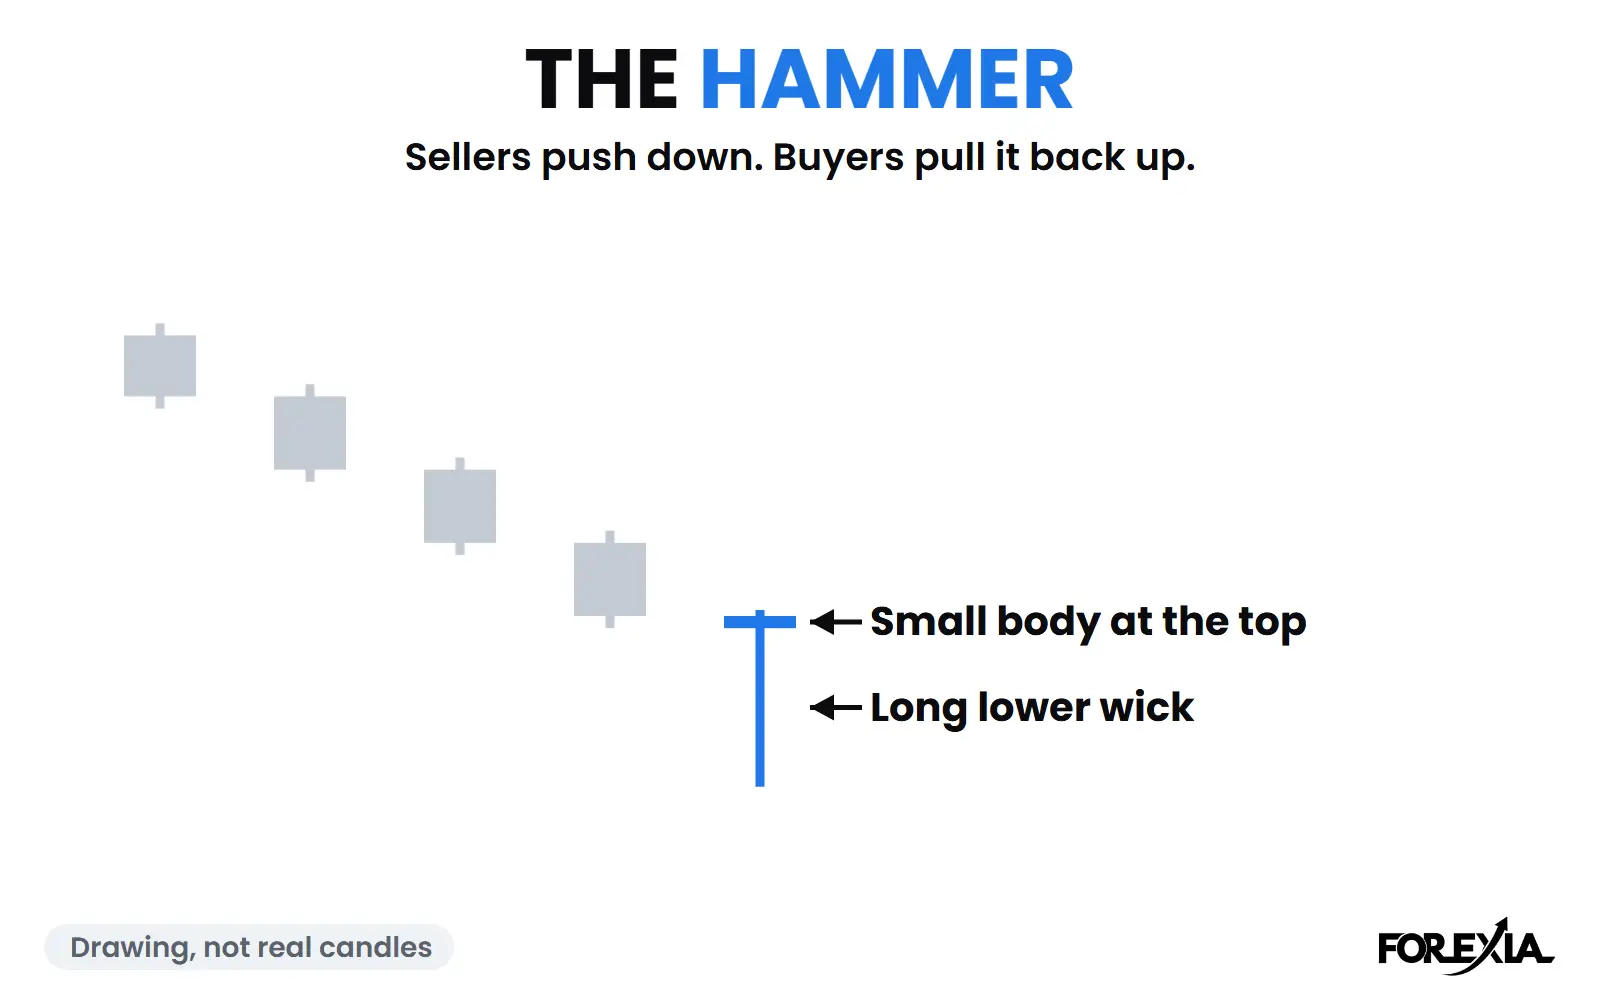
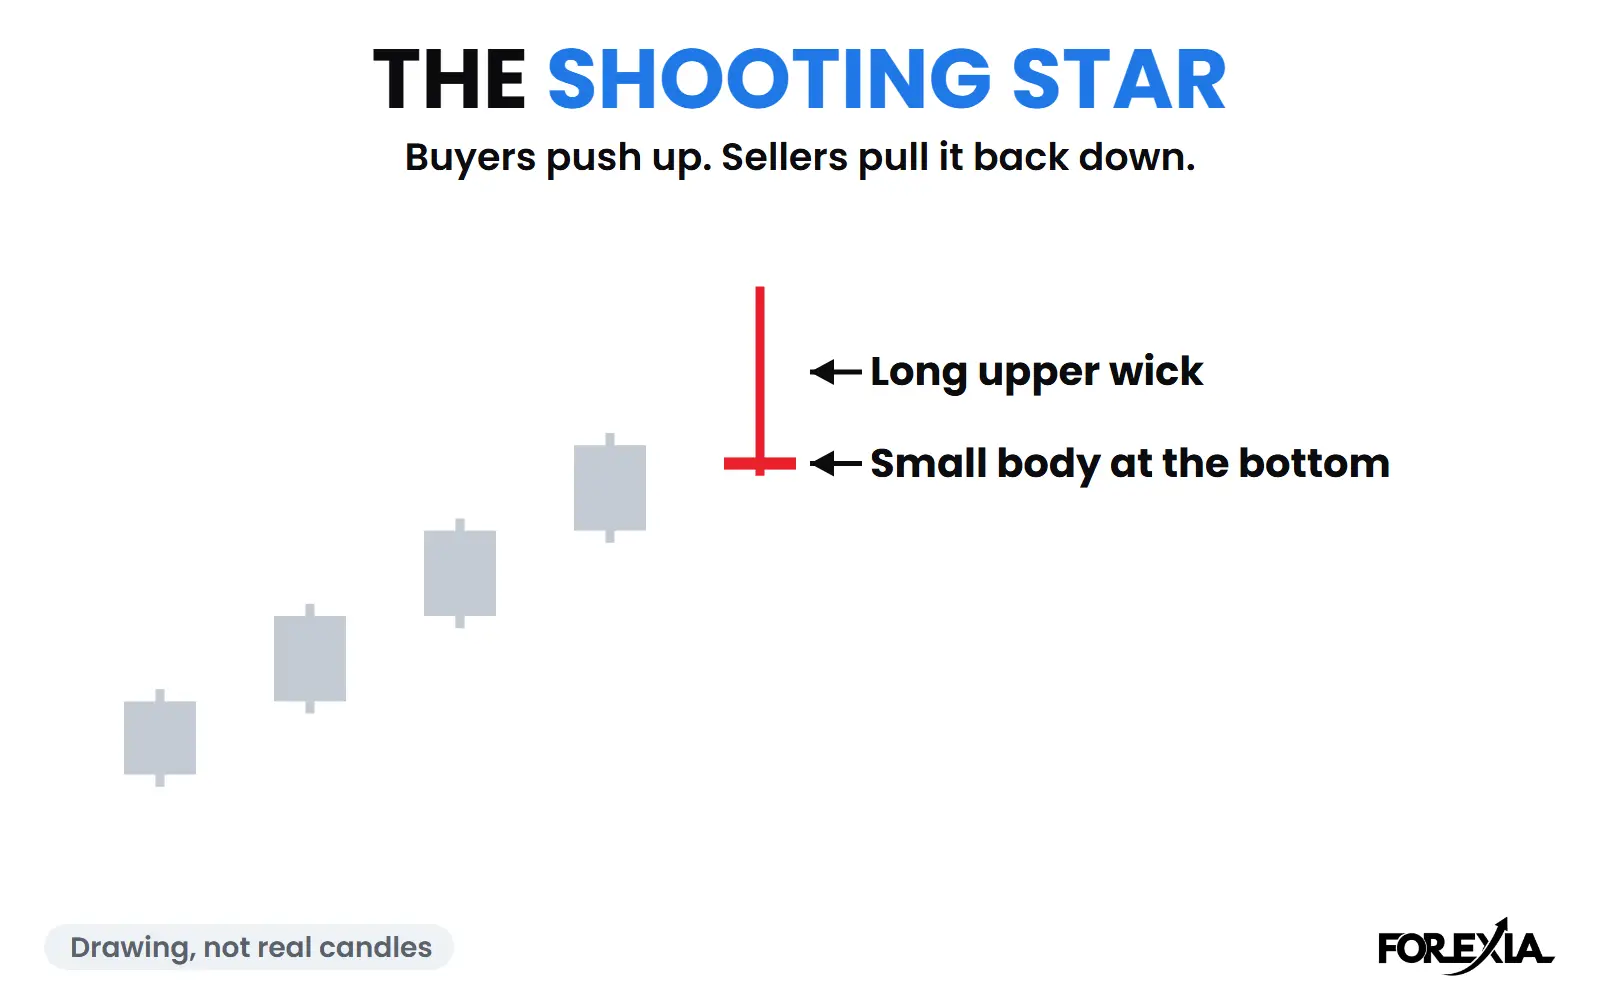
Both are one candle with a long wick. The hammer has a long lower wick and a small body near the top: sellers pushed price down, and buyers pulled it back up. Books read it after a fall. The shooting star is its mirror, with a long upper wick and a small body at the bottom, read after a rise. The long wick is also called a pin bar.
The engulfing candle
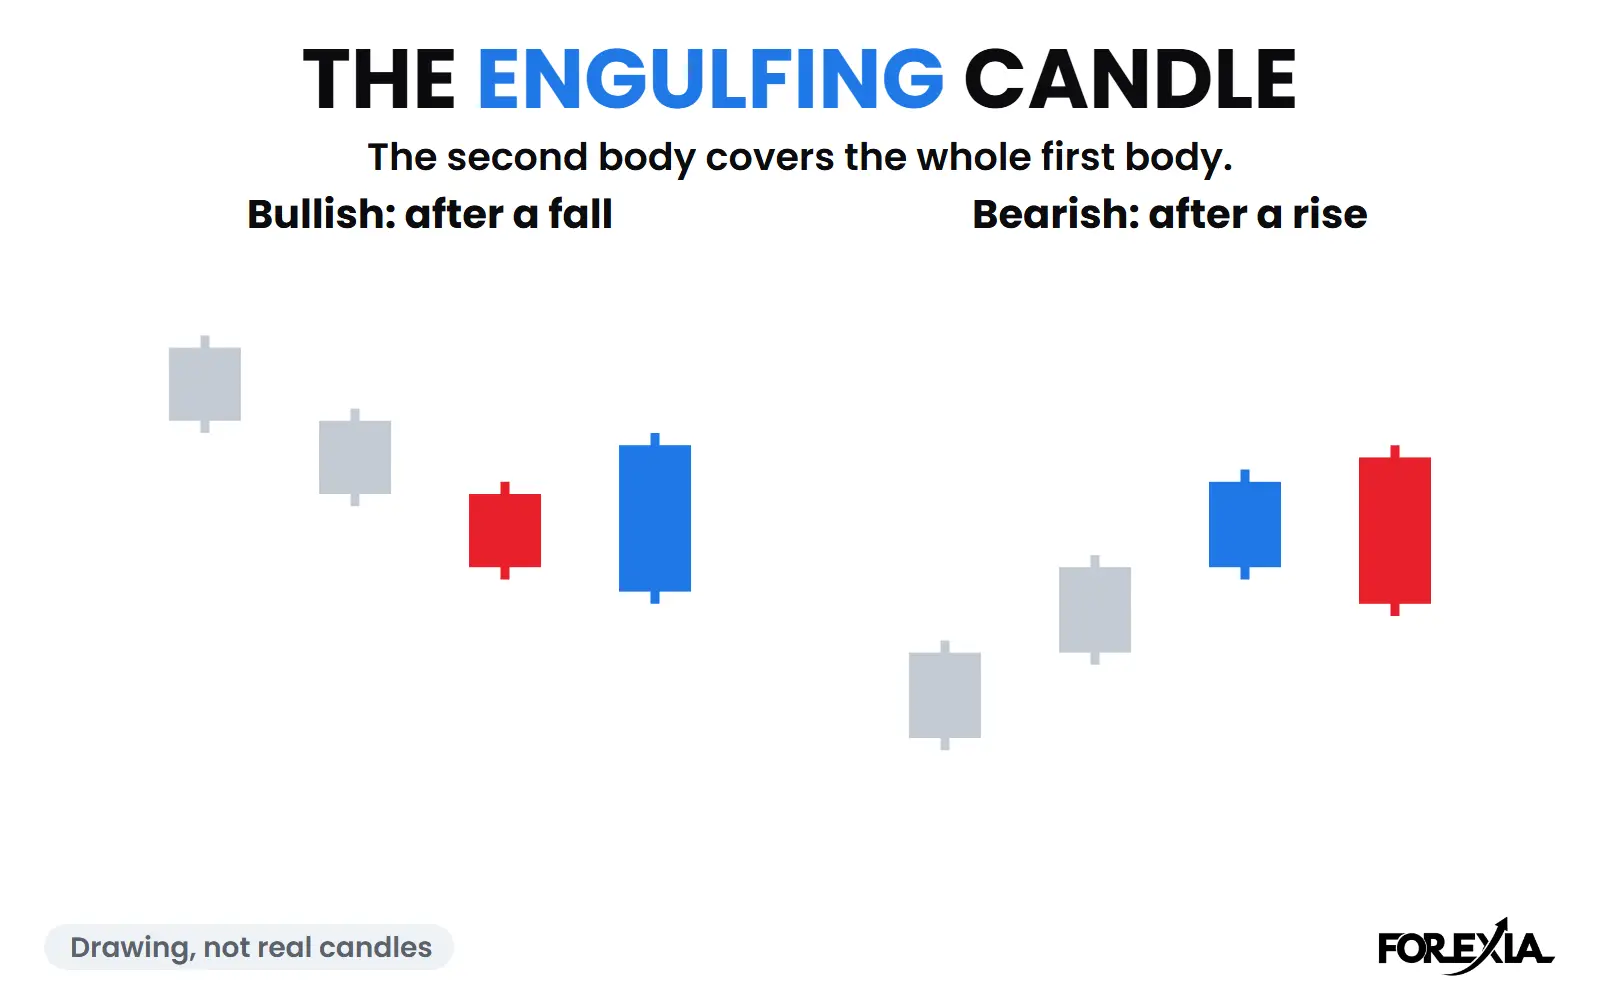
Two candles. The second body covers the whole body of the first and points the other way. A bullish engulfing candle follows a fall, with a blue body over a red one, and a bearish one follows a rise.
The morning star and the evening star
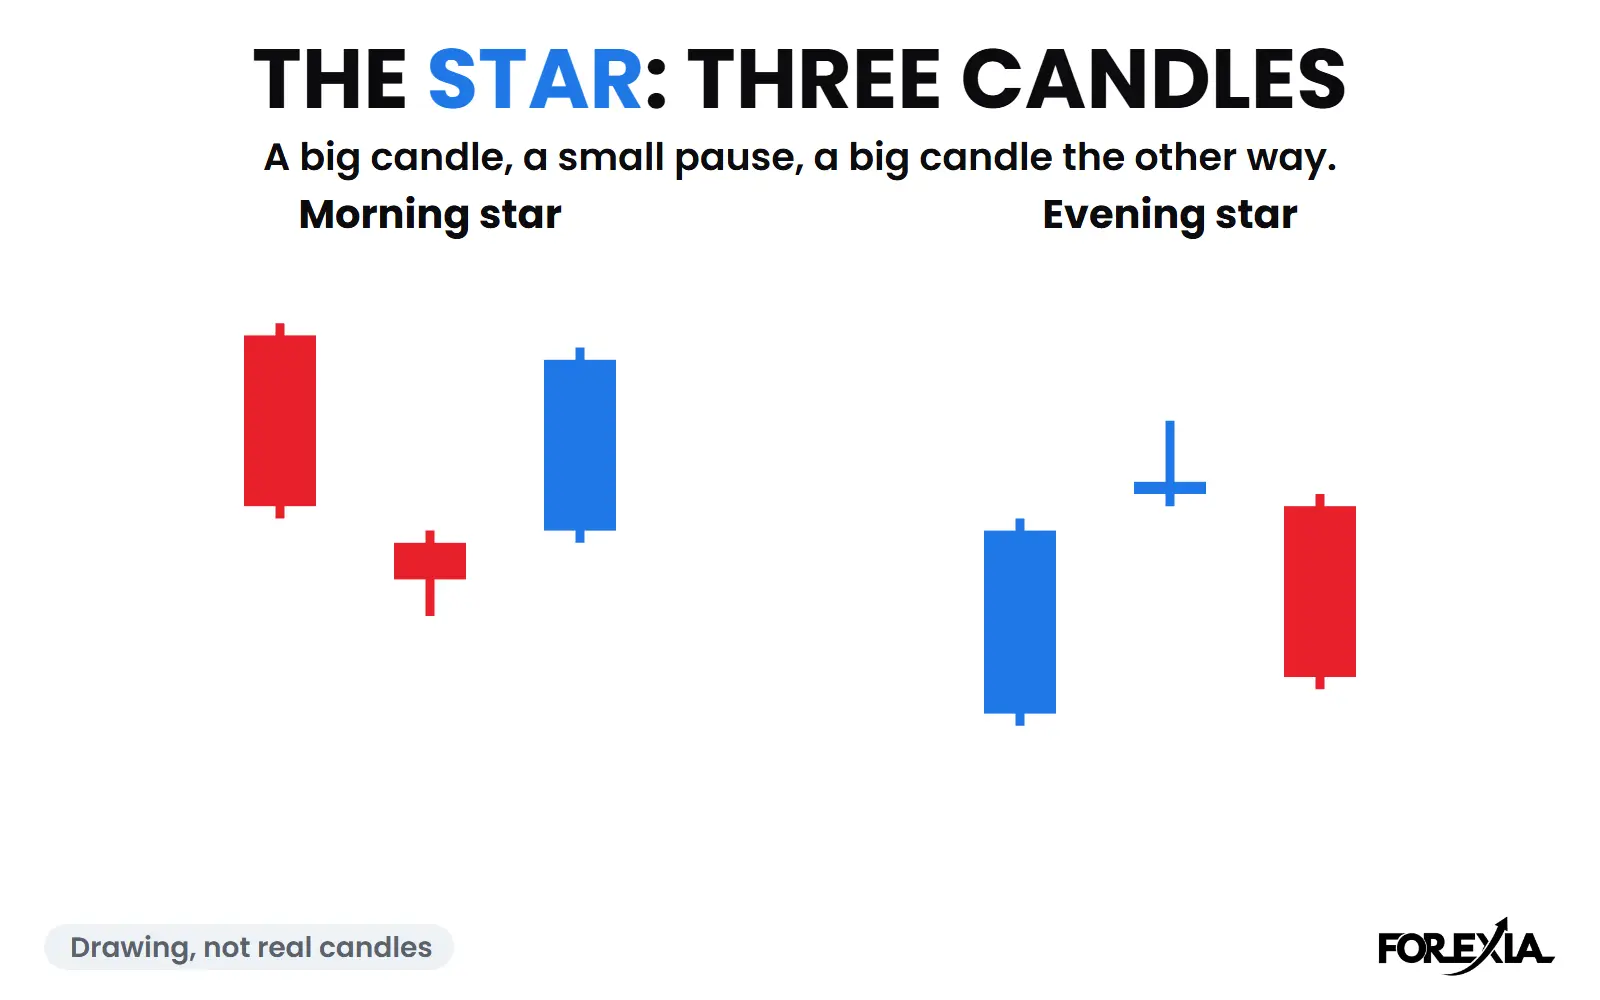
Three candles. A big candle in the trend's direction, a small one that pauses, then a big candle the other way. The morning star turns a fall up, the evening star turns a rise down.
The doji
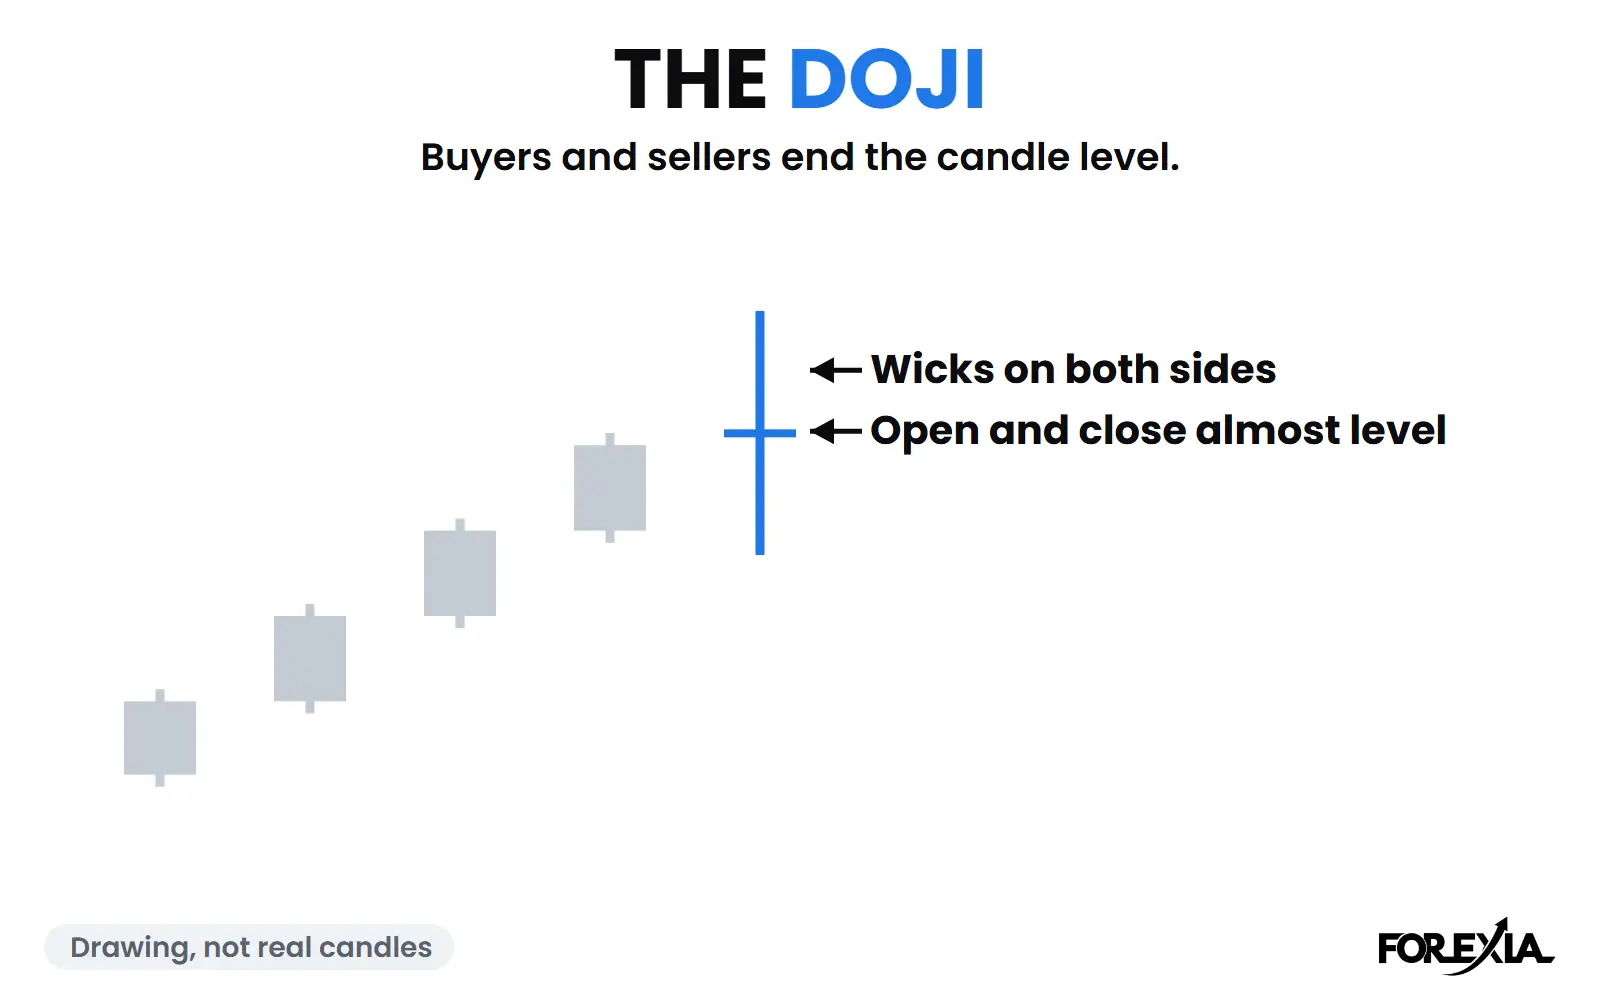
A candle that opens and closes almost level, with wicks on both sides. It says buyers and sellers ended the candle even. On its own it says that and no more, which is why guides ask for a candle after it.
The piercing line and the dark cloud cover
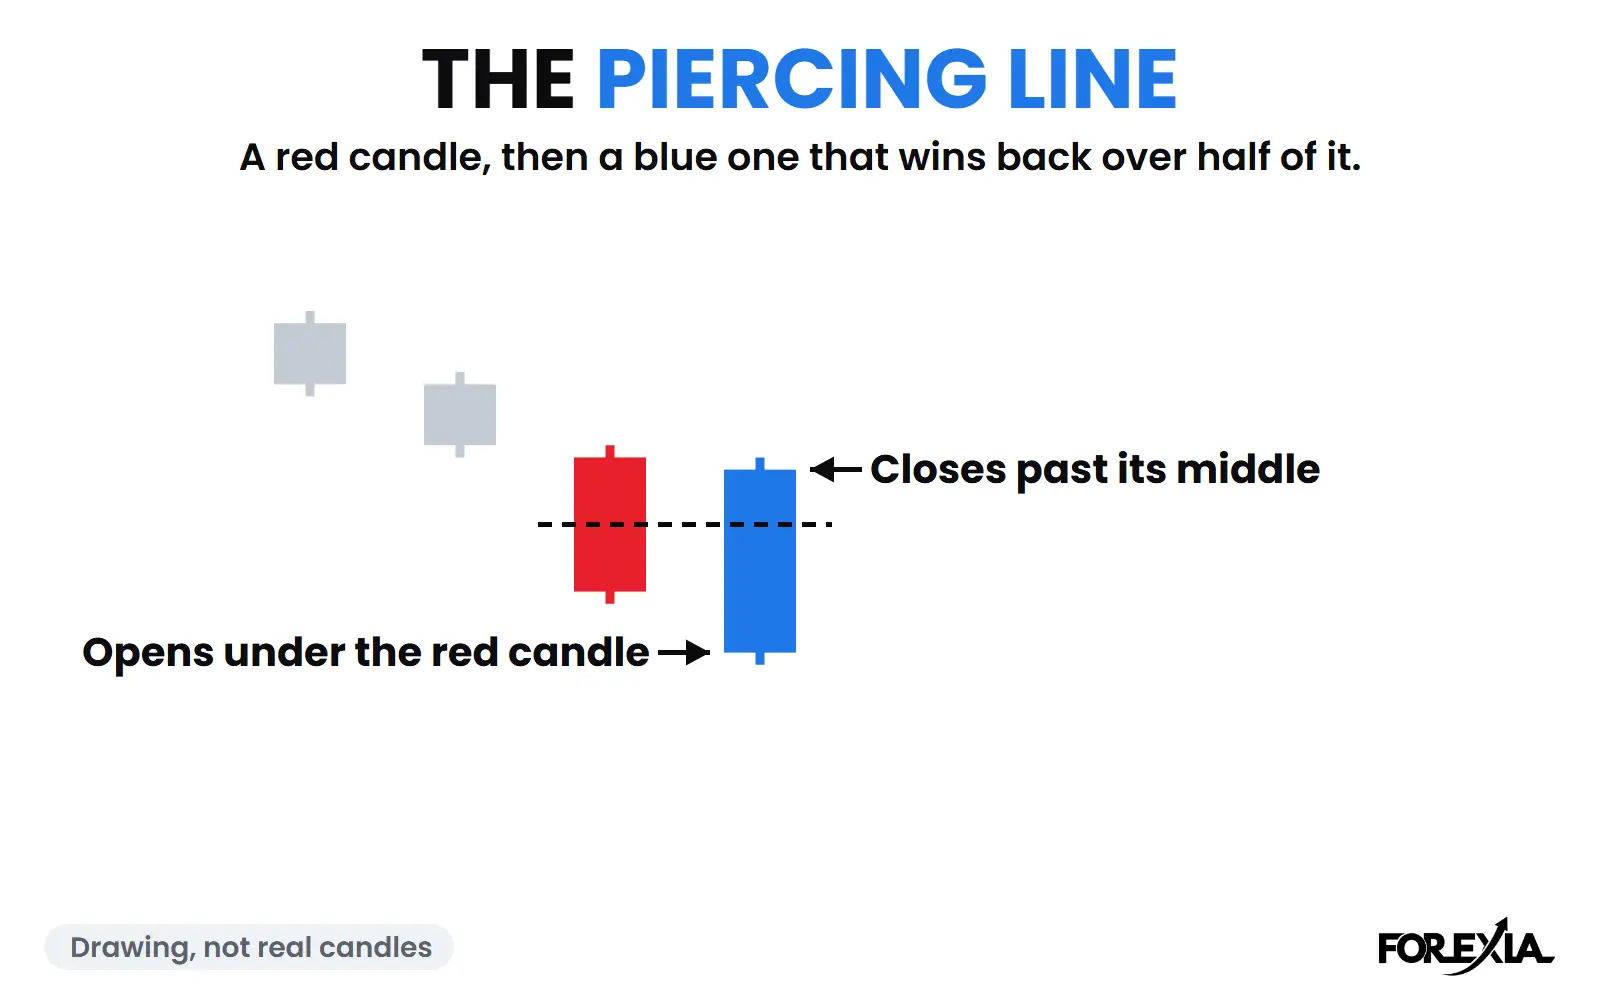
Two candles. After a fall, a red candle, then a blue one that opens under it and closes past its middle. The dark cloud cover is the mirror after a rise.
What is the difference between a bullish and a bearish reversal candle?
The direction of the trend before it, and nothing else. A bullish reversal candle sits at the end of a fall and is read as buyers taking over. A bearish one sits at the end of a rise and is read as sellers taking over. The same candle shape can be either: a long wick under a small body after a fall is a hammer, and the same candle after a rise is called a hanging man. That is why a shape found with a scanner and no trend is worth little.
How do you confirm a reversal candlestick pattern?
The usual textbook answer is to wait for the next candle. A bullish pattern is confirmed when a candle closes over the pattern's high, and a bearish one when a candle closes under its low. Confirmation costs part of the move, and it does not make the pattern work. It only shows that the next candle went the way the pattern said.
Where does the stop go on a reversal candlestick pattern?
The usual place is just past the pattern's far end: under the low of a bullish pattern, over the high of a bearish one. The distance from entry to that stop is the risk on the trade, and it sets how large the trade can be: the position size calculator turns it into lots.
One point the books leave out: everyone reading the same shape puts the stop in the same place. That row of stops is a pile of orders that a fast candle can reach, as why stop losses sit above highs explains, and a stop that is reached and then price turns is the usual way a stop loss gets hit.
Which reversal candle is the strongest?
We cannot say, and we would doubt a page that did. Books tend to rate the engulfing candle and the star above one-candle shapes, because they need more candles before they show. That makes them rarer. It does not make them right more often, and we found no count that shows it. Our own tests are of other shapes: the double tops and bottoms and the wedges on the price action page. We have not run these six.
Pin bar or engulfing candle?
They answer different questions.
- A pin bar is one candle judged by its wick. The wick is the story: price went there and was refused. It can be any size, and the body's colour matters less than the wick's length.
- An engulfing candle is two candles judged by their bodies. The story is the second body covering the first. It asks that the first candle exists, so a quiet market gives few.
Neither comes with a count in the guides we read. What decides the trade is the same in both: where the stop goes, how far the target is, and what the market was doing at that minute.
How does one shape end on real days? Gold on 11 September 2026
On gold on 11 September 2026 the 08:30 candle, the one the US CPI report landed on, opened at 4340.86, ran down to 4291.95, up to 4362.23 and closed at 4353.61. Its lower wick was $48.91 long, its body $12.75 and its upper wick $8.62. That is a hammer's shape. Times are New York, candles are 15-minute Dukascopy, and on gold $1 counts as 1 pip.
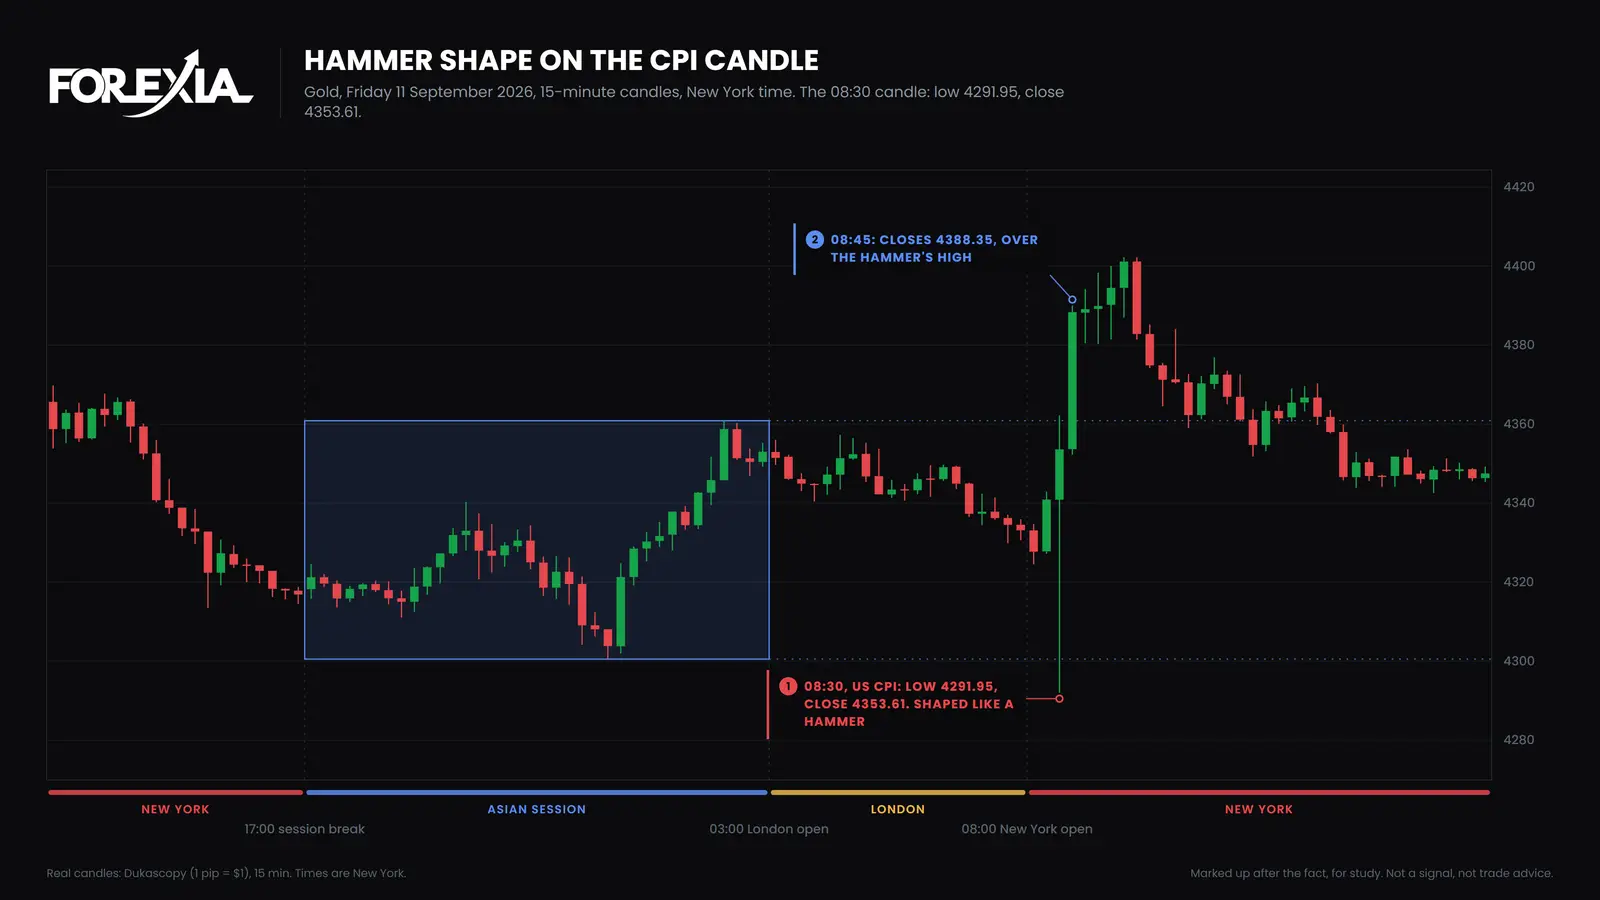
- The lead-up. The morning had slipped from a high of 4360.85 at 02:00 to a close of 4327.70 at 08:00, and the 08:15 candle closed at 4340.90. It is a small fall, not a long one.
- The candle. The low, 4291.95, is the low of the day, printed at 08:30.
- The confirmation. The 08:45 candle closed at 4388.35, over the hammer's high of 4362.23, so the textbook would call it confirmed. The day's high was 4402.27 at 09:45, a range of 110 pips.
This candle is also our own Reversal Candle, defined by what it did rather than its shape: one huge candle through the stops, just after the crowd got in. The trap candle page reads this same day from the crowd's side.
And when the same shape does not turn? GBP/USD on 12 August 2026
On GBP/USD on 12 August 2026 the 08:30 candle, again the US CPI report, opened at 1.35278, ran down to 1.35070, up to 1.35454 and closed at 1.35377. Its lower wick was 20.8 pips, its body 9.9 and its upper wick 7.7. It is a hammer's shape again.
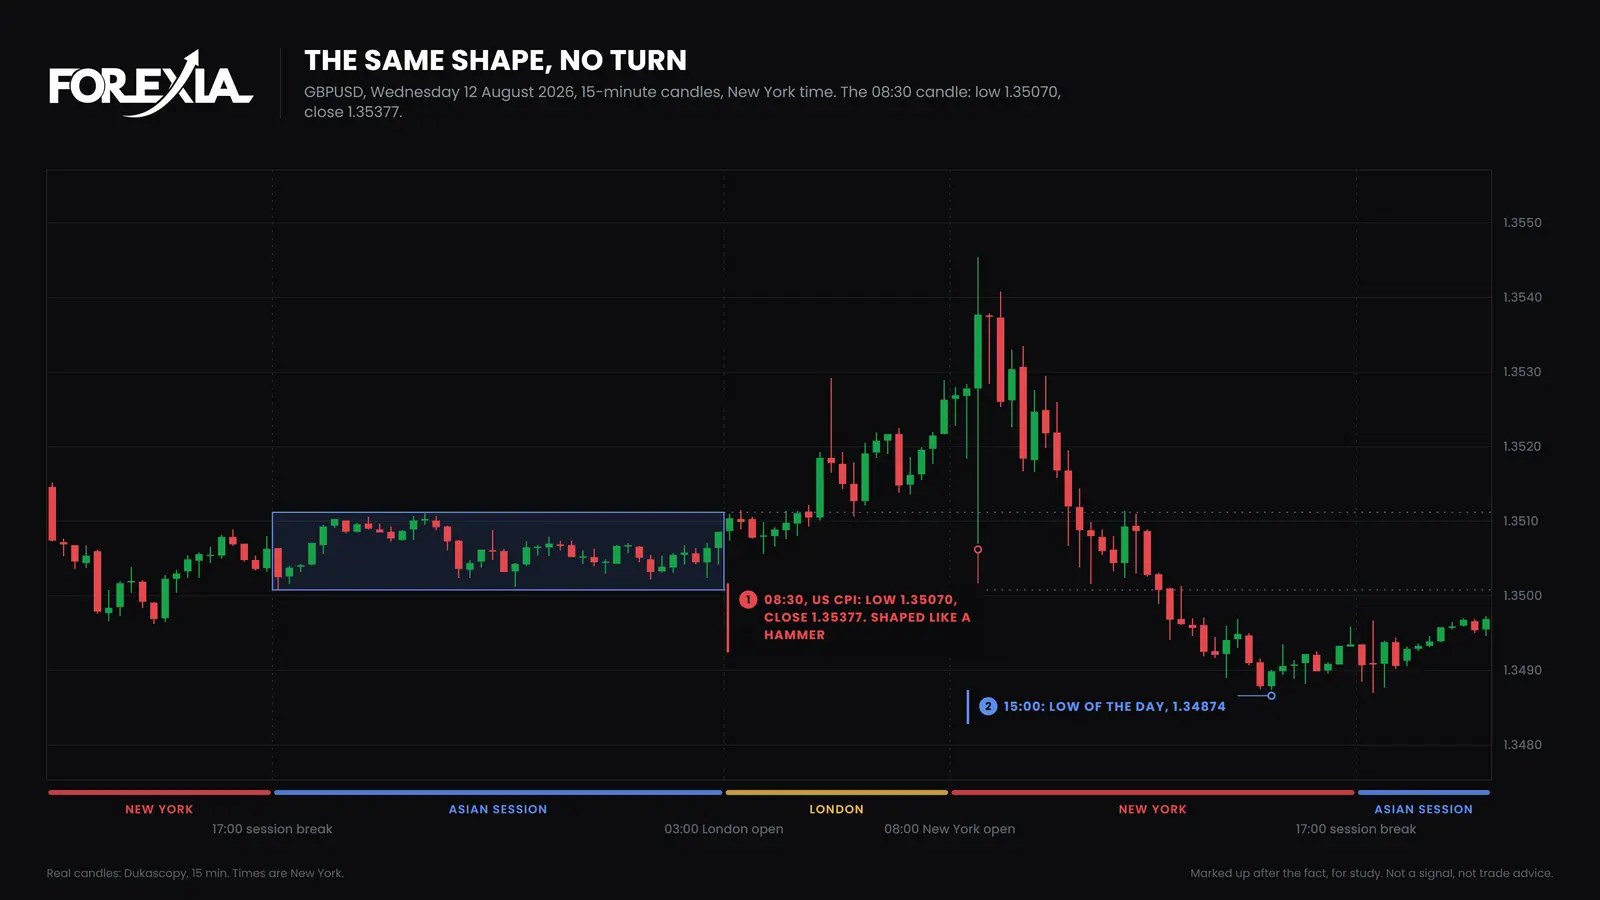
- The lead-up. Price had been rising, from 1.35045 at 00:15 to 1.35278 at 08:15. A textbook would not call a hammer after a rise a hammer at all. A scanner that looks only at the candle would.
- No confirmation. The 08:45 candle closed at 1.35374, under the candle's high of 1.35454, and 09:00 closed at 1.35260.
- The day. The high of the day, 1.35454, is this candle's own high. The low, 1.34874 at 15:00, was about 20 pips under the hammer's low. The day's range was 58 pips.
The same shape on the same kind of minute held the low of the day on gold and the high of the day on GBP/USD. We chose these two days afterwards because they show it, and we do not claim they are typical.
How often is the minute, not the shape, the event?
We counted the minute. On seven majors and gold, from 6 April to 1 October 2026, there were 240 market-days with a high-impact US release at 08:30. The 08:30 candle held the day's high or low on 43 of them, and on the 790 market-days with no such release it held on 14. The day runs session break to session break, on 15-minute candles. The count is from scripts/seo-counts.mjs (releaseCandle, saved in content-web/seo-map/counts.json). Eight markets move on one dollar, so it is a small sample, and it says when to look, never which way.
So the release minute marks the day's extreme about one release market-day in six, against about one in fifty-six on days without one. What the candle looked like is a different question, and we did not count shapes. The shape is not the event: the report landed, the stops were reached, and the shape is what that left on the chart.
What to do with a reversal candlestick pattern
Four habits, in this order, keep the shape in its place.
- Read the trend before it. A hammer after a rise is not a hammer.
- Look at the clock and the calendar. A shape on a release minute is the release first and a pattern second.
- Fix the stop, then the size. Work out the distance to the stop before you consider the entry, and size from it.
- Treat confirmation as a cost. It tells you the next candle agreed. It does not tell you the one after will.
Frequently asked questions
Three questions people type most, answered short.
What are the main reversal candlestick patterns?
Six turn up in every guide: the hammer and shooting star, the engulfing candle, the morning and evening star, the doji and the piercing line with its mirror, the dark cloud cover. Each is a shape, and a shape says only what the candles looked like.
Where does the stop go on a reversal candlestick pattern?
Just past the pattern's far end: under the low of a bullish pattern, over the high of a bearish one. Other traders put theirs there too, so it is where a fast candle lands. Fix the distance first and size the trade from it.
Which reversal candle is the strongest?
We have not tested these six, so we do not rank them. Books rate the shapes that use more candles higher because they are rarer to find. We know of no count that shows they work more often.
Sources
Three sources, and what each one gave this page.
- Dukascopy historical 15-minute candles: the candles for gold on 11 September 2026 and GBP/USD on 12 August 2026.
- US Bureau of Labor Statistics, Consumer Price Index: the release schedule behind the 08:30 CPI candles.
scripts/seo-counts.mjsandcontent-web/seo-map/counts.json: the 43 of 240 release-minute count, 6 April to 1 October 2026.
Learn to read the chart this way. The courses teach the day's structure first and the candle last. Browse the courses.
This post is for study. It is not a signal and not trade advice. Candles: Dukascopy, mid price, 15-minute, New York time. The six candle diagrams are drawings, not real candles.
Tools for this
Frequently asked questions
What are the main reversal candlestick patterns?
Six turn up in every guide: the hammer and the shooting star (one candle with a long wick), the bullish and bearish engulfing candle (two candles), the morning and evening star (three candles), the doji (open and close almost level) and the piercing line, with its mirror, the dark cloud cover. Each is a shape, and a shape only says what the candles looked like.
Where does the stop go on a reversal candlestick pattern?
The usual textbook place is just past the pattern's far end: under the low of a bullish pattern, over the high of a bearish one. That is also where other traders put theirs, so it is where a price spike lands. Size the trade from the stop's distance, never the other way round.
Which reversal candle is the strongest?
We have not tested these six shapes, so we do not rank them. Books tend to rate the shapes that use more candles (the engulfing candle, the star) above one-candle shapes, because they ask for more before they appear. That is a reason they are rarer, not a measured edge.
Is a pin bar better than an engulfing candle?
They are different questions. A pin bar is one candle judged by its wick, and an engulfing candle is two candles judged by their bodies. Neither came with a count behind it in the guides we read. On our days one candle with a pin bar's shape marked the low of the day and another marked the day's high.