Trap Candle Forex: The One Huge Candle That Takes Your Stop
Dylan Forexia9 min read
A trap candle in forex is a candle that catches traders on the wrong side, and the name has no fixed definition. Indicators use it for small two-candle patterns. We use the plain meaning: one huge candle that takes the stop of whoever just got in. Our word for it is the Reversal Candle. This page shows it from the wrong side, on real days.
What is a trap candle in forex?
It depends who is selling the indicator. Three definitions turn up on the page:
- A two-candle rule. The candle breaks the last candle's low and closes above its high, or the mirror of that.
- A range sweep. The candle goes past a range's high or low and closes back inside, usually with a long wick and a jump in volume.
- A candle against a trend tool. A momentum candle pointing the opposite way to a line on the chart, soon after price touched a swing high or low.
All three are written as signals to act on, and none we read gives a sample or a dated day. Ours is the reverse. It is read from the seat of the trader the candle has just stopped, on a real day, with no signal in it.
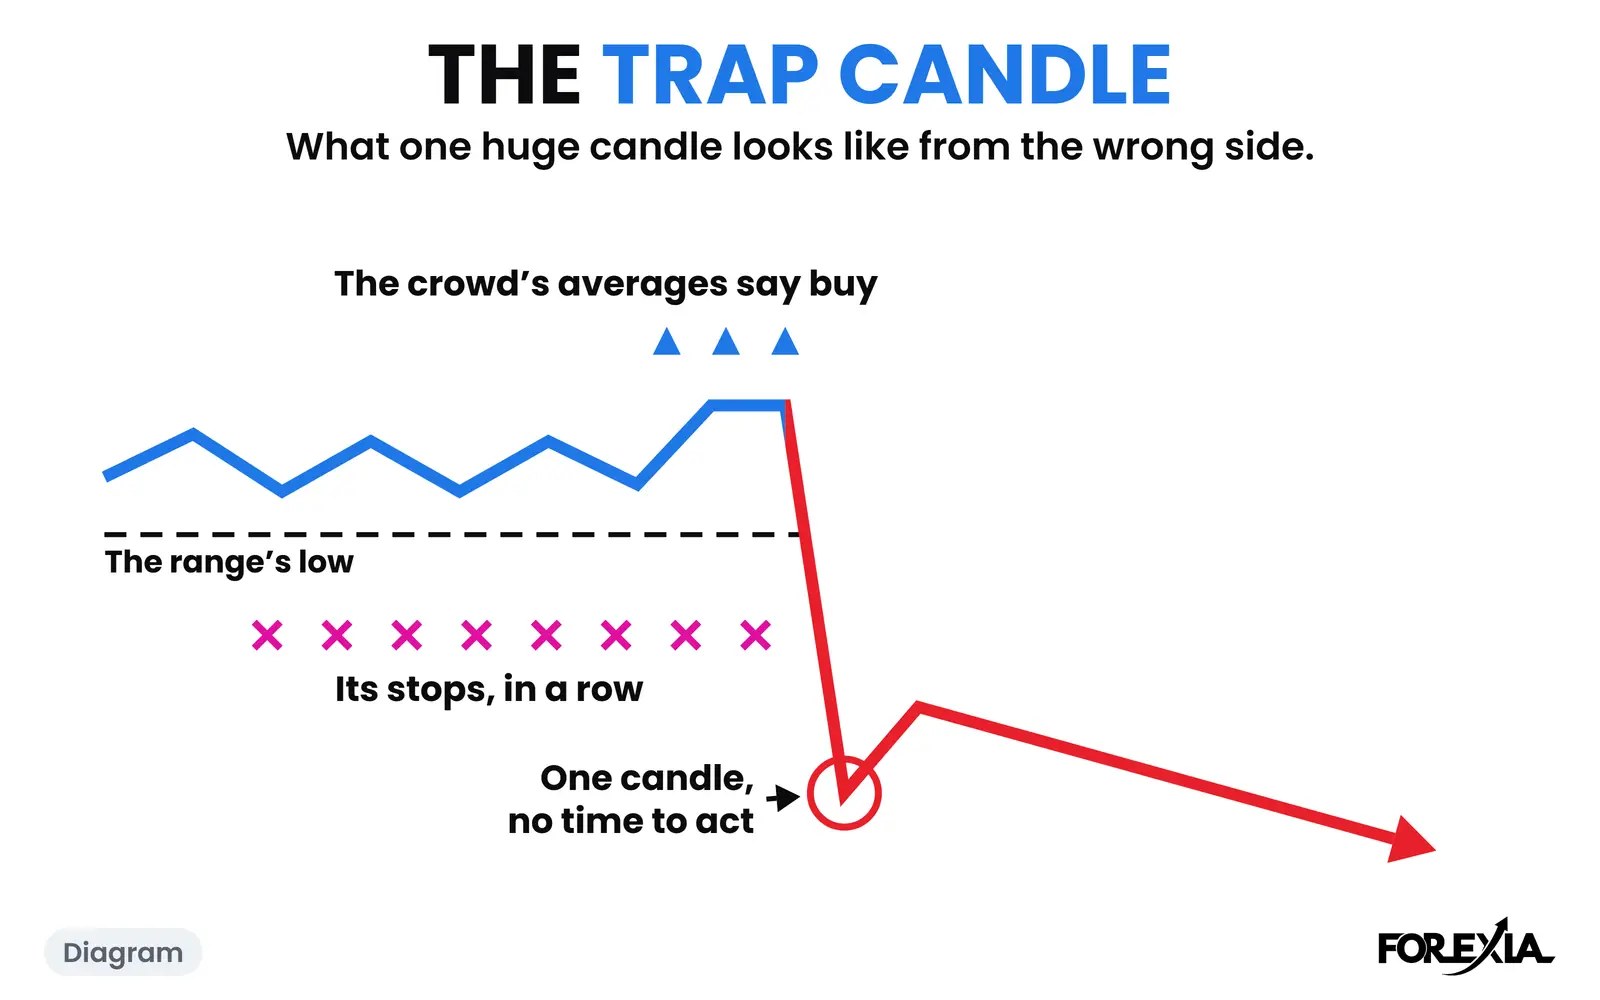
So the Reversal Candle is one huge candle through the stops, straight after the crowd gets in. Its size is what makes it hurt: the stop is filled inside the candle along with every other stop in its row, with no time to act. The comparison with pin bars and engulfing candles is on the Reversal Candle's own page. This page stays with the candle on the news, and the guide to news trading has the wider picture. All times are New York, and a candle is named by the time it opens.
What a trap candle looks like from the wrong side: AUD/USD, 4 September 2026
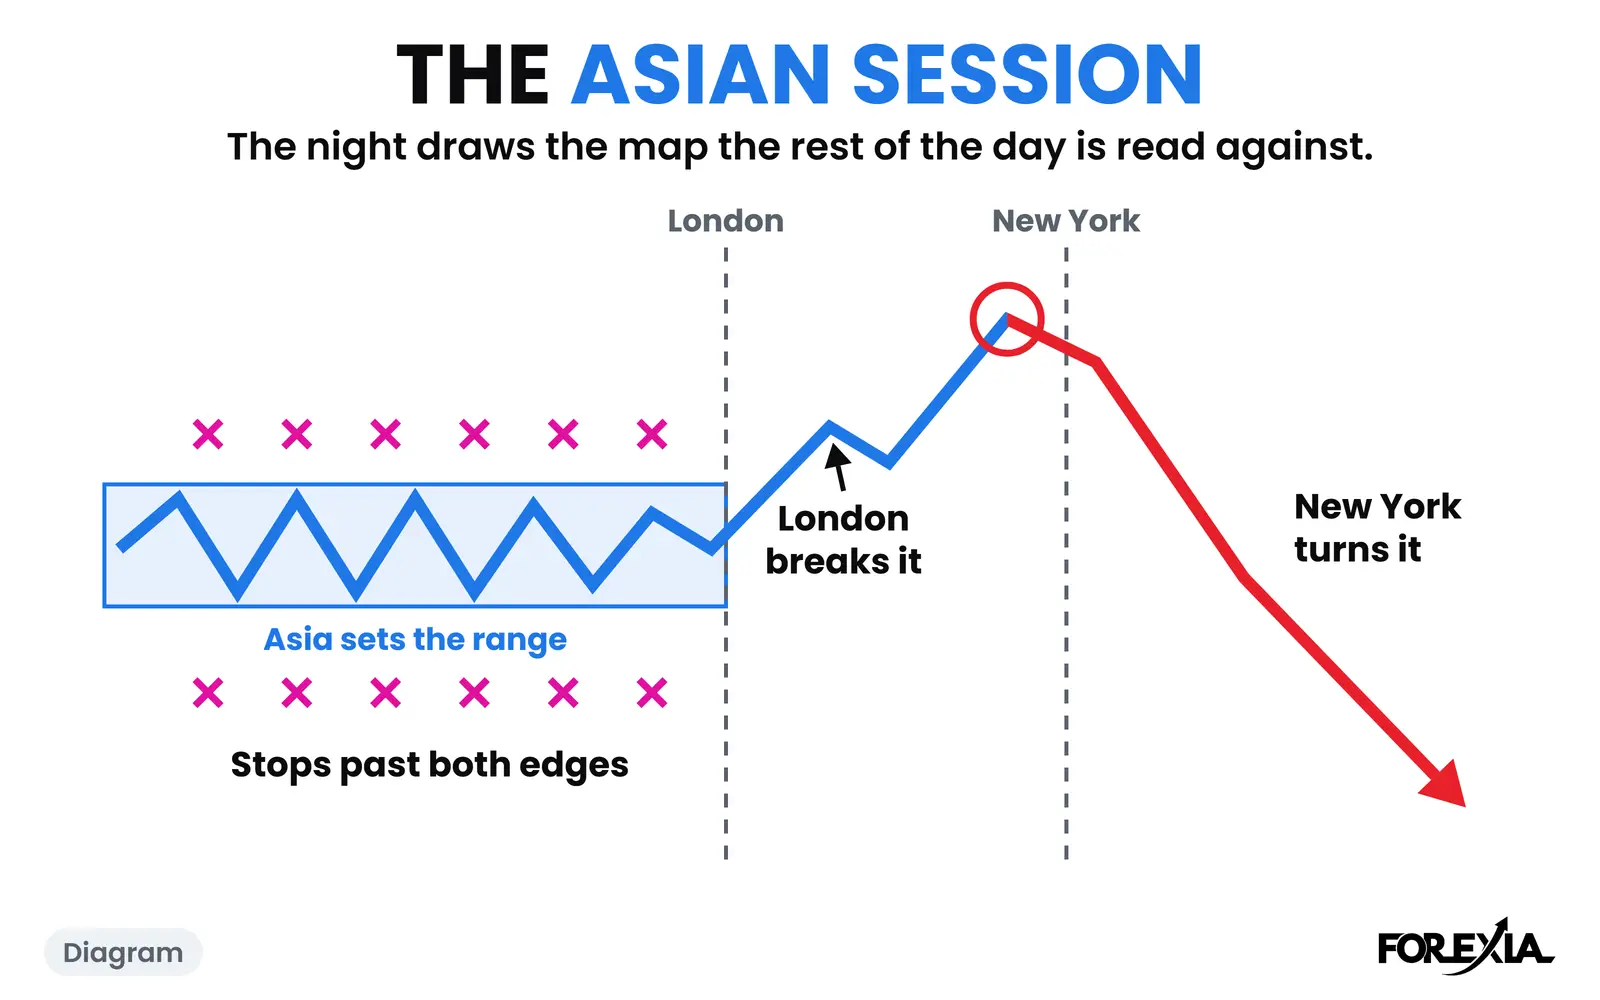
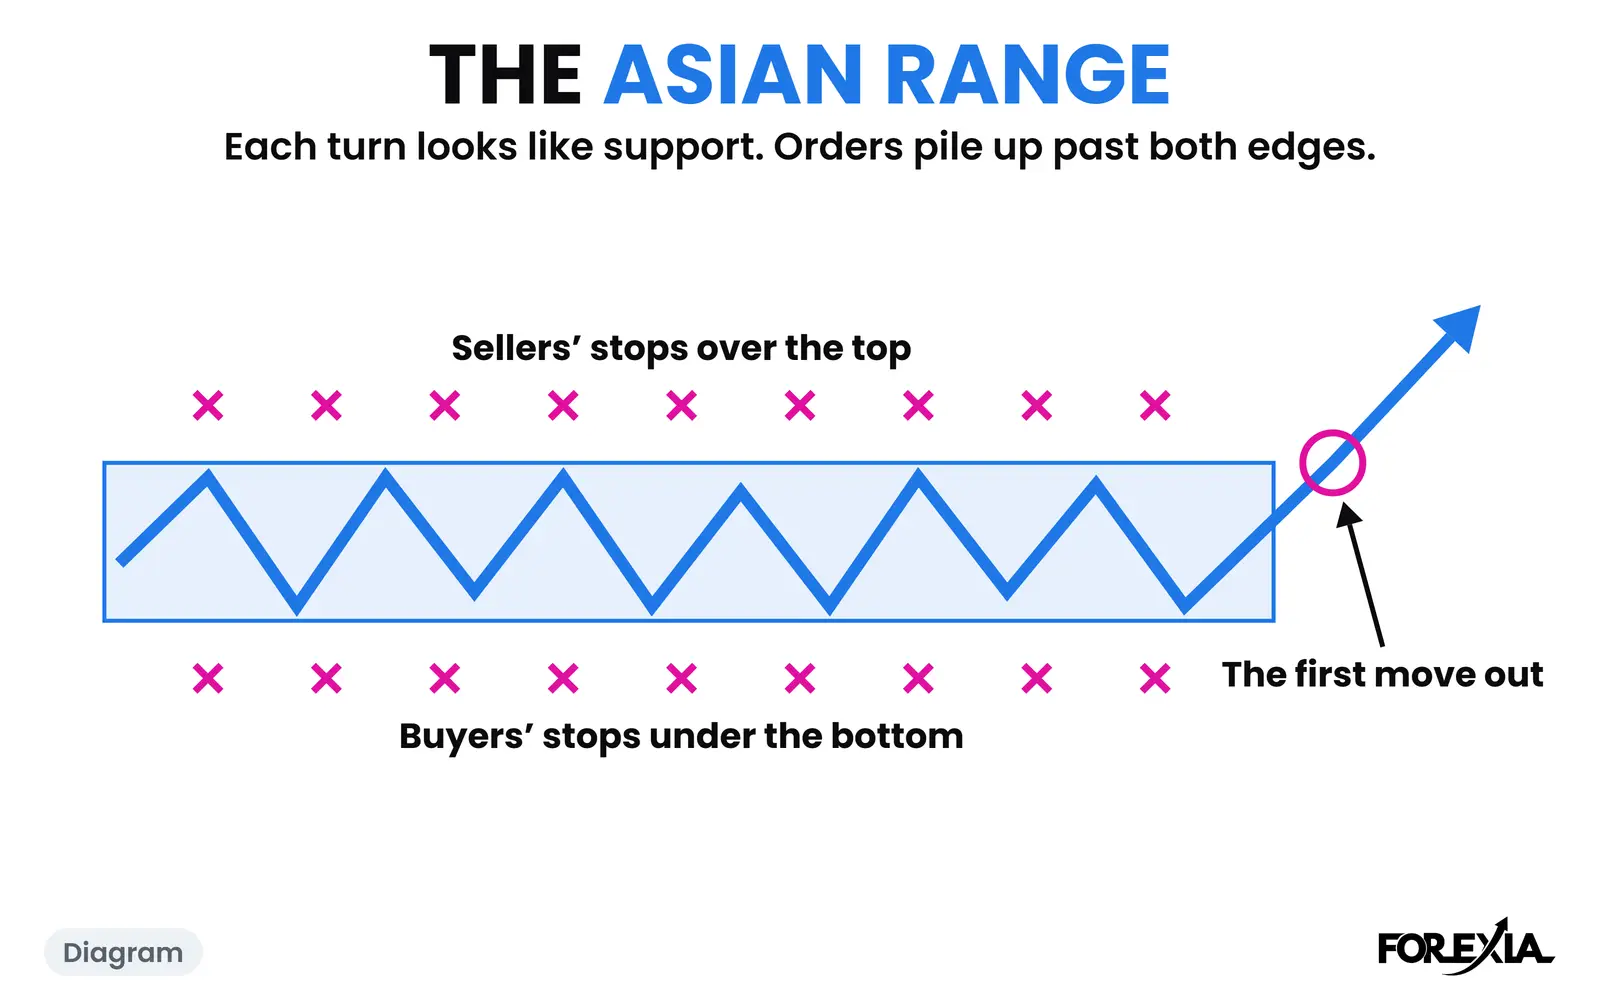
AUD/USD's Asian Box was 20 pips, 0.71939 to 0.72142. From the London open to 08:15 every close stayed inside it, and London's low of 0.71956 was only a wick. It was a dull morning, with the jobs report on the calendar for 08:30.
The lines on the chart below are labelled for what they are: THE CROWD'S AVERAGES, the 20 and 50 EMA of the 15-minute closes. They are what the crowd sees, and we draw them here to show where it gets in. They are not our tool. The 08:15 candle closed 7 pips higher, at 0.72098, and the 20 crossed over the 50. It was a thin cross, but the screen said buy.
A buyer there has a textbook place for a stop: under London's low, under the box, or both. Those rows sat about 15 pips away, in a market that had been moving a few pips a candle. It looked safe, for the good reason that the box had held for hours.
Then came the 08:30 candle. It opened at 0.72097, a tenth of a pip under its high, and fell to 0.71736, 36 pips from end to end, 20 under the box and 22 under London's low. The averages crossed back down on that close. From the wrong side there is nothing to do. The trade is open at 08:15 and closed by the candle after it, and the fill can be well past the stop's price, as NFP spreads and slippage covers.
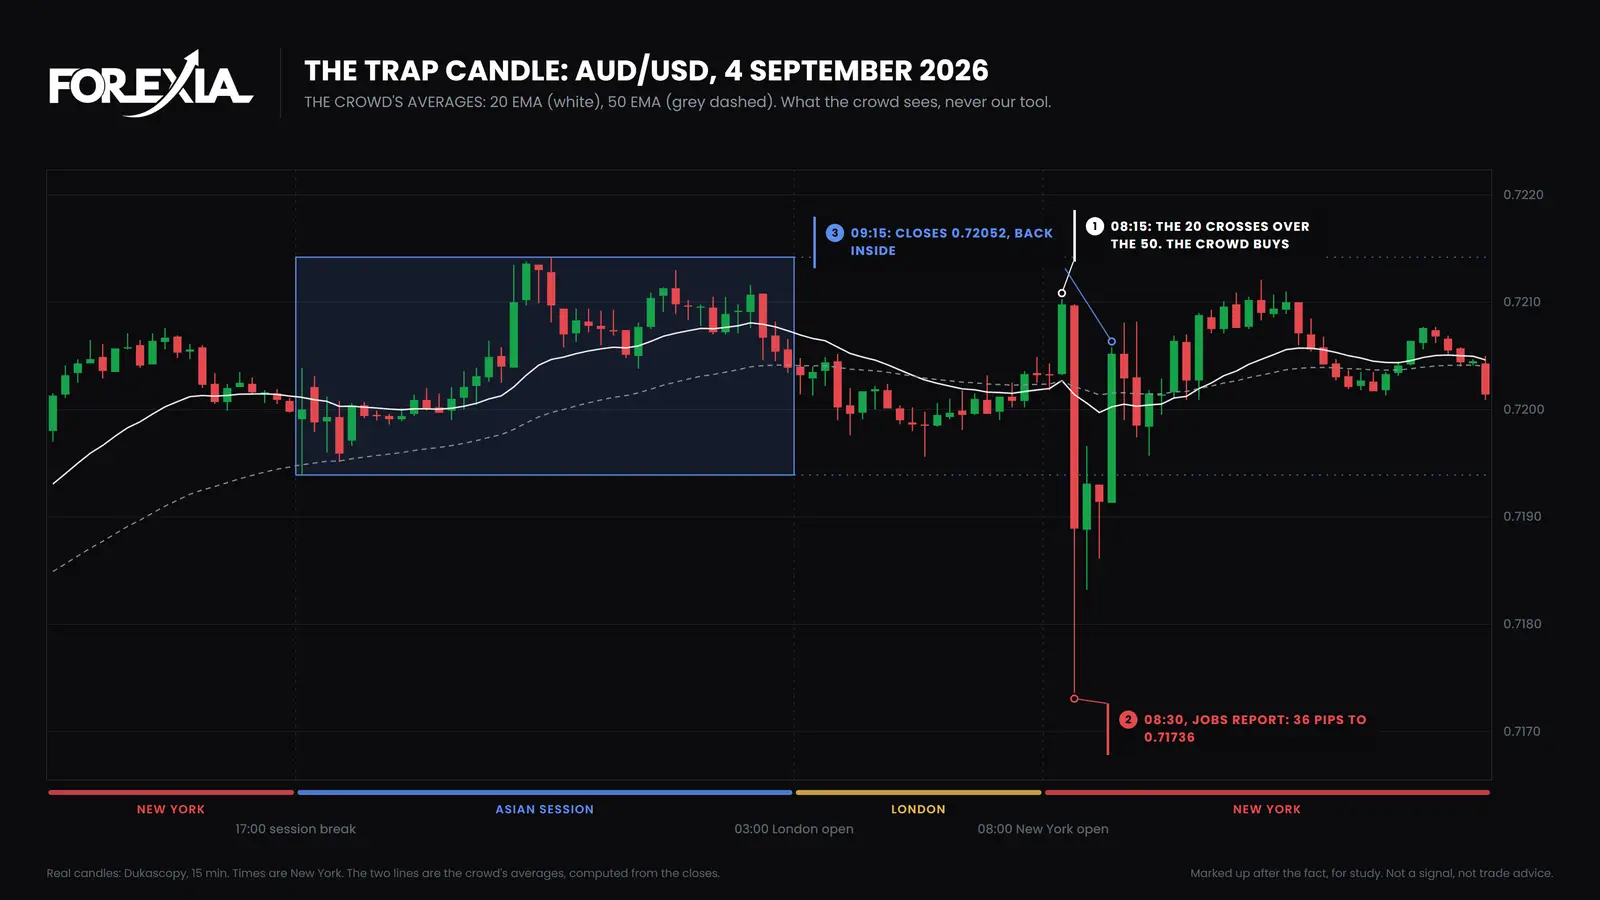
The candle closed at 0.71889, 5 pips under the box, and it looked like a breakdown. Two candles stayed under the box. The 09:15 candle then closed back inside at 0.72052, an hour after the release, and at 12:15 price reached 0.72121, 39 pips off the low. That low held for the day.
So one candle had two names. For the crowd that bought at 08:15 it was the candle that took the stop. For the day, on our read, it was the stop hunt, a liquidity sweep of the stops under the box. The trapped traders were right about nothing except that price would later go up, and that was no use to them by then.
A trap candle that paid first: gold, 11 September 2026
Gold's day ran the other way up, and it has one cruelty the Aussie's did not. Our glossary page gives the candle whole, so here are the minutes that matter to a seller. On gold we count $1 as 1 pip.
The 08:00 candle closed red at 4327.70, and the 20 crossed under the 50. Sell, says the screen, with a stop over London's high at 4357.27. US CPI came out two candles later.
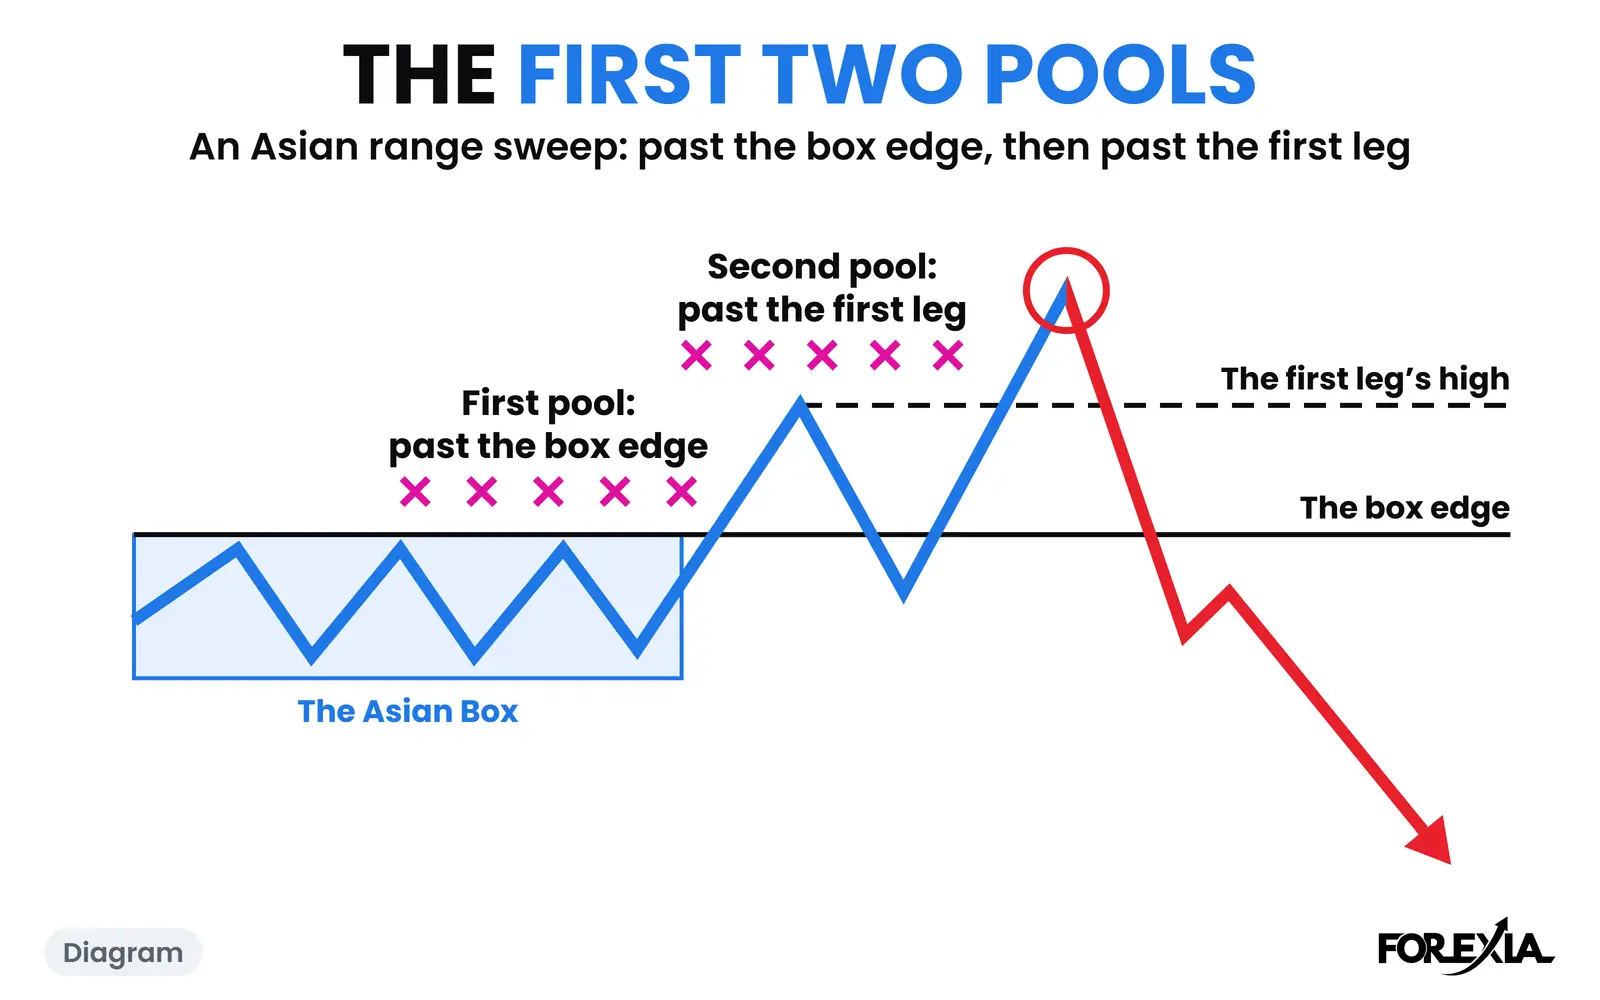
The first minute went the sellers' way. From 4340.86 it fell to 4291.95, more than 35 pips in their favour and the low of the day. For that moment they had read it right. Price then climbed for ten minutes, and at 08:40 it traded 4361.78, over London's high and the top of the box. The stop went there. The whole thing happened inside one 15-minute candle that opened at 4340.86 and closed at 4353.61.
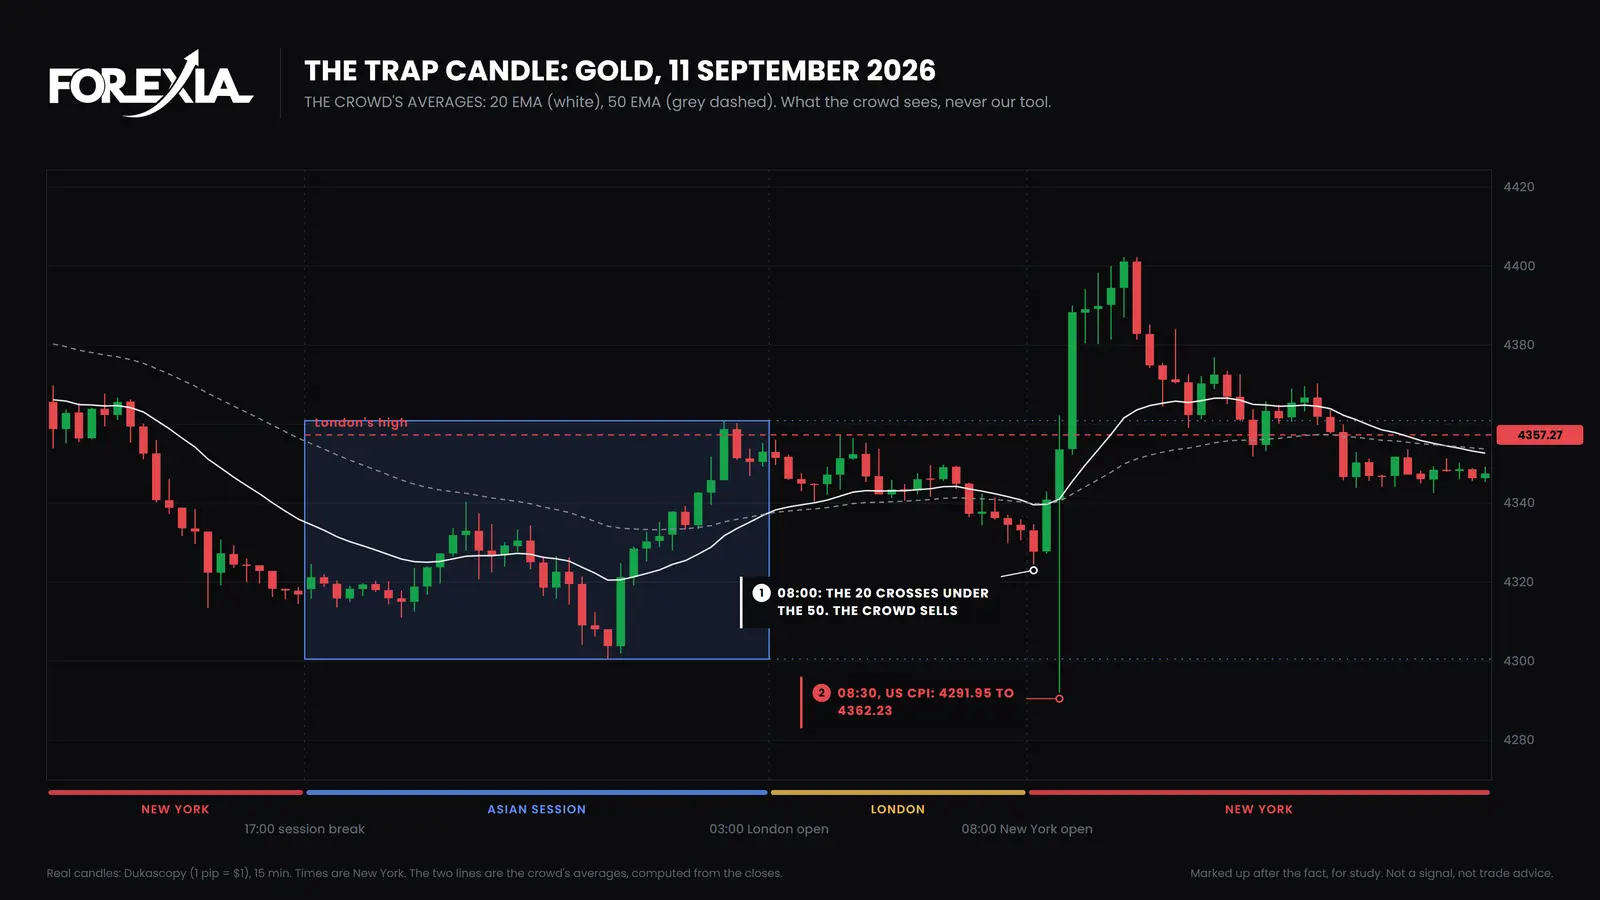
A trap candle can show you a profit before it takes your stop. The next candle closed at 4388.35, and by 09:45 gold had reached 4402.27.
Why does one huge candle reverse the market?
Often it does not, and this day is the one page one leaves out. On AUD/USD on Thursday 2 July 2026 the jobs report landed at 08:30. The 08:15 candle closed at 0.68909 and the 20 crossed under the 50: sell, says the screen. Sellers' stops had three obvious homes above: the box top at 0.69021, London's high at 0.69110 and Wednesday's high at 0.69193.
The 08:30 candle opened at 0.68909, dipped to 0.68885 and ran to 0.69415, 53 pips from end to end, with the candle before it only 4.5 pips tall. It went through all three rows and closed at 0.69389, and the averages crossed back up on it.
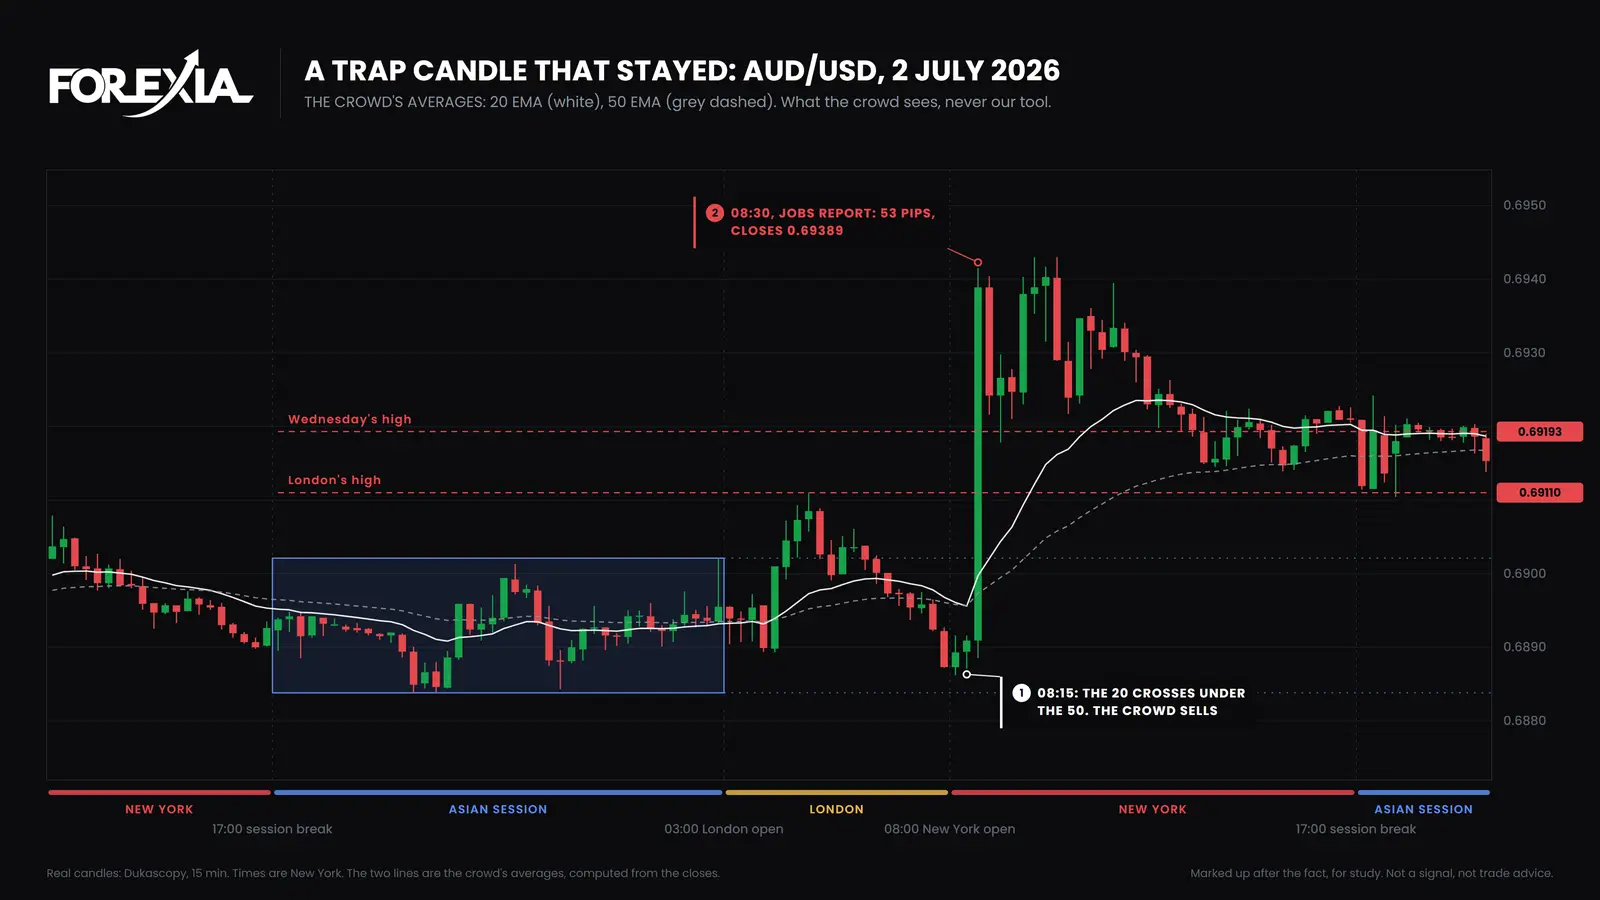
For the seller the trap was the same as on the other two days. For the day there was no reversal of that move. The high came at 09:45, at 0.69430, 2 pips past the candle's high, and price then drifted. The 13:30 candle was the first to close back under Wednesday's high, just over five hours after the release, and the day ended at 0.69209, a pip and a half over that high.
So the candle says which stops went. It does not say where the day ends. When it does turn, we read that as stops firing once, with nothing left to push price on, which why price spikes, then reverses takes up. When it does not, nothing on the chart says why, and the price action gives no warning of which you are in.
How do you spot a trap candle?
Only afterwards, as a candle. What could be seen in advance on these days was the setting. On AUD/USD on 4 September it was the jobs report on the calendar, a box that had held every close since London's open, and a cross on the 08:15 candle. Gold on 11 September had CPI and a cross on the 08:00 candle, and AUD/USD on 2 July the jobs report and a cross on the 08:15 candle. That setting is why these are the dumb money's worst minutes. The averages tend to arrive late, as The Trap shows with a count.
These three days were picked afterwards because they show it, and days like them are rare. On seven majors and gold from 6 April to 1 October 2026 there were 240 market-days with a high-impact US release at 08:30. The crowd's averages crossed on the 08:00 or 08:15 candle on 7 of them, and the 08:30 candle closed against that cross on 5. Three of those 5 are the days above. So most release candles do not follow a cross, and the averages remain what the crowd sees, not our tool.
We have also counted the minute. On those 240 market-days the 08:30 candle held the day's high or low on 43, and on the 790 market-days with no such release it held on 14. The day runs session break to session break, on 15-minute candles. Eight markets move on one dollar here, so it is a small sample, and it says when to look, never which way. The wider stop hunt guide has the counts on how far past a level these runs go.
What did each seat see?
The Three Seats read AUD/USD on 4 September three ways.
- Retail saw a cross and a held range. Buy, with the stop where the books put it, under the box. Then one candle.
- The market maker, as we read it, saw one pile of orders. The crowd's entries and its stops sat together, and the release minute was a known time to fill them. Nobody outside can see those orders, so this is a reading.
- The observer noted the cross as what the crowd sees, not as a reason to trade, then read what the day did: 22 pips under London's low, a close 5 pips under the box, and a close back an hour after the release.
Common mistakes
Four readings cost the crowd most on these days.
- The 08:15 buy on 4 September. On AUD/USD the averages crossed on the candle before the jobs report. The next candle was 36 pips the other way.
- The stop under the box. Every close from London's open had stayed inside it, which made that stop look safe. One candle went through both rows.
- Selling the 08:30 close on 4 September. It closed 5 pips under the box and looked like a breakdown, and by 09:30 a candle had closed back inside. The NFP stop hunt shows the same Friday on other markets.
- Selling the 2 July candle as a reversal. Price stayed up for hours, with the high 2 pips past the candle's at 09:45. A reversal seen afterwards is not a setup, and our own fixed rule of trading against hunts on a high-impact release lost money after costs.
Course 2 of ForexiaPRO, The Chaos Pattern, teaches this read step by step in lesson 2.3.4, The Reversal Candle.
Frequently asked questions
What is a trap candle in forex?
It has no standard definition. Indicators use it for a two-candle pattern that breaks one side of the last candle and closes past the other, or for a sweep of a range that closes back inside. We use the plain meaning: one huge candle that takes the stop of whoever just got in. Our word for it is the Reversal Candle.
Why does one huge candle reverse the market?
Often it does not. On AUD/USD on 2 July 2026 a 53-pip jobs candle took the sellers' stops, and price stayed up there for hours. When it does turn, we read the candle as the stops firing all at once, with nothing left to push price further. On AUD/USD on 4 September 2026 that candle's low held as the low of the day.
Can you spot a trap candle before it prints?
No, only the setting: a scheduled release, a quiet market and a crowd that has just got in. Afterwards the candle is easy to name. On our count the 08:30 candle held the day's high or low on 43 of 240 market-days with a high-impact US release and 14 of 790 without. That says when to look, never which way.
Is a trap candle a signal to trade the other way?
We do not treat it as one. Named afterwards it looks like a signal, but in the moment it can run further or never turn. Our own fixed rule of trading against hunts on a high-impact release lost money after costs. A reversal seen afterwards is not a setup.