Why Do Breakouts Fail? Follow the Orders, Not the Line
Dylan Forexia7 min read
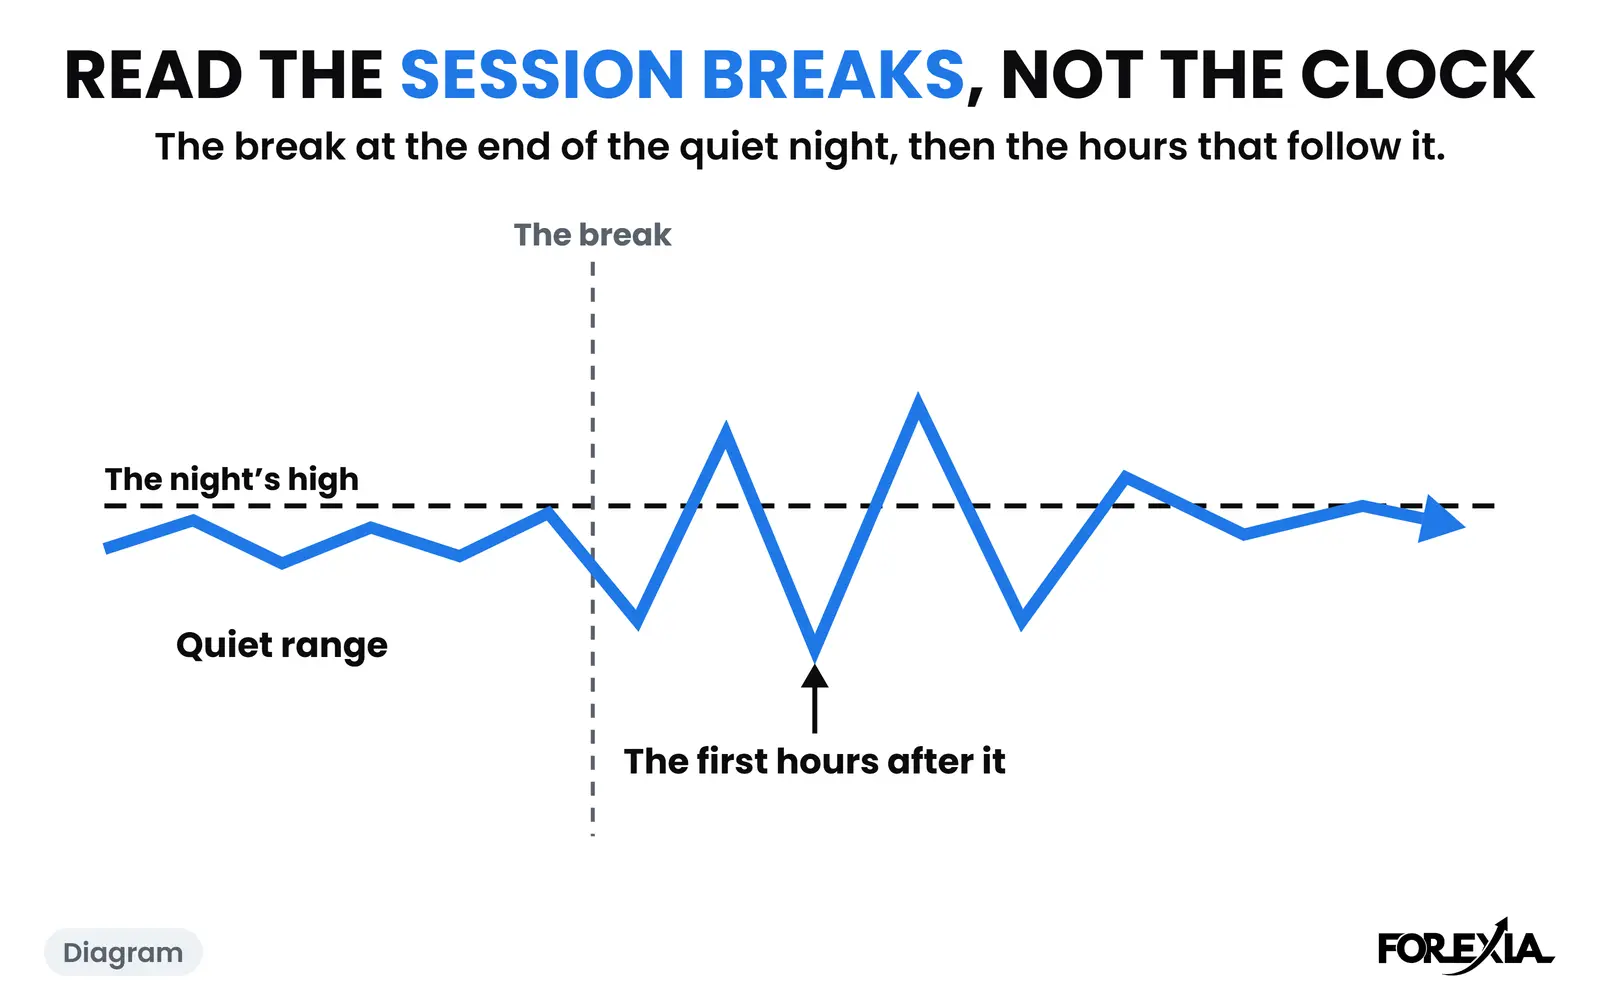
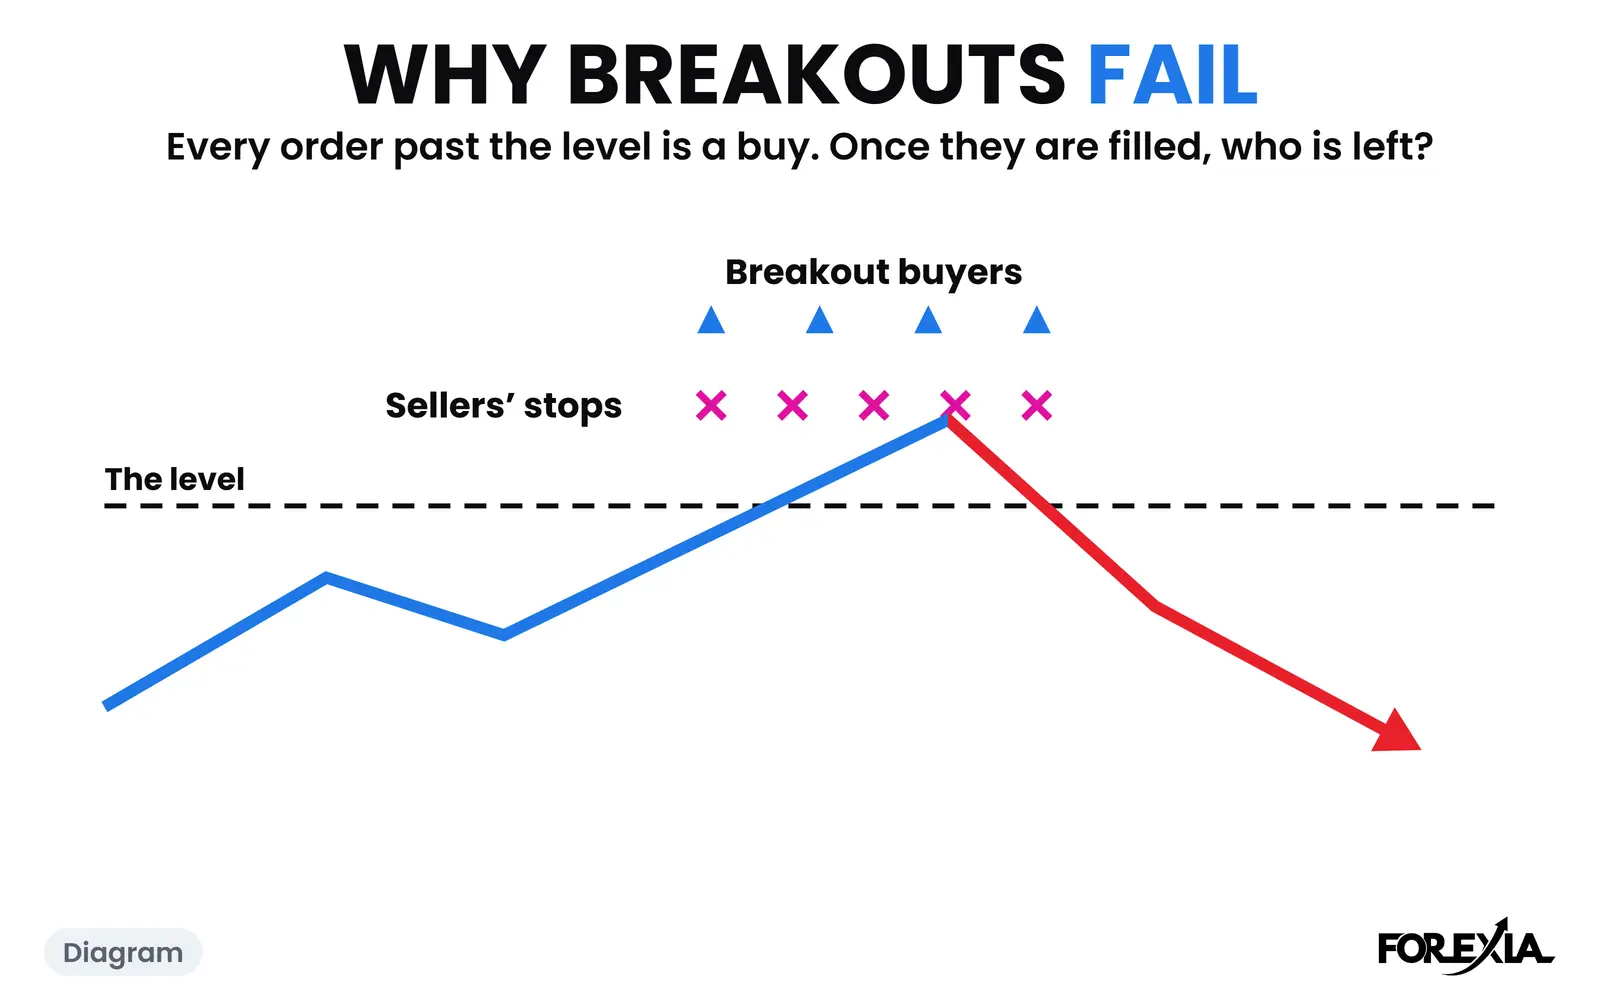
A breakout fails when the buying that pushed it past a level runs out. The break itself creates a crowd of orders: breakout traders entering, and the stops of everyone who sold the level, which are buys too. Once those fill, nobody may be left to buy. We read the failure from the orders, and not from the line.
Most pages on this search list causes: low volume, a weak trend, news. Those are real, and the list is below. But the list does not say whose orders sit past the level, and why the break creates them. That is the part we add, on two real days and a count of 1,601 breaks. It is our read of the orders, and no chart can show the orders themselves.
Why do breakouts fail? Because every order past the level is a buy
Three groups buy past a level, and all of them are in the same place. Breakout traders enter on the break, because the textbook says to. Traders who sold the level with a stop just past it are stopped out, and a stop on a short is a buy order. And traders who see the break and chase it join late.
That is one pile of buys at one price. For a large buyer, the pile is a problem: to buy in size they need sellers, and past a high there are few. For a large seller, it is the opposite. It is buyers at last, and somewhere to sell without chasing price down. We read it from the market maker's seat, and we call the move the stop hunt. Once the orders are filled, price has nothing pushing it, and it falls back through the line. The breakout buyers' own stops sit just back inside the level, and the same fall takes those too.
None of this needs anyone to aim at anything. A move can also fail because it never had demand: the breakout came in a thin hour, or ran on a headline and faded. The candle looks the same either way, which is why we say "we read this as" and never "they did this".
What does a failed breakout look like on a real day? AUD/USD, 13 July 2026
On Monday 13 July 2026, AUD/USD left a 24-pip Asian range from 0.69233 to 0.69474. Price climbed to the top of it in stages. The 04:00 New York candle reached 0.69450 and the 04:15 candle 0.69467. Each stalled under the line. At 07:00 a candle touched 0.69480, 0.6 of a pip over, and closed back under at 0.69448.
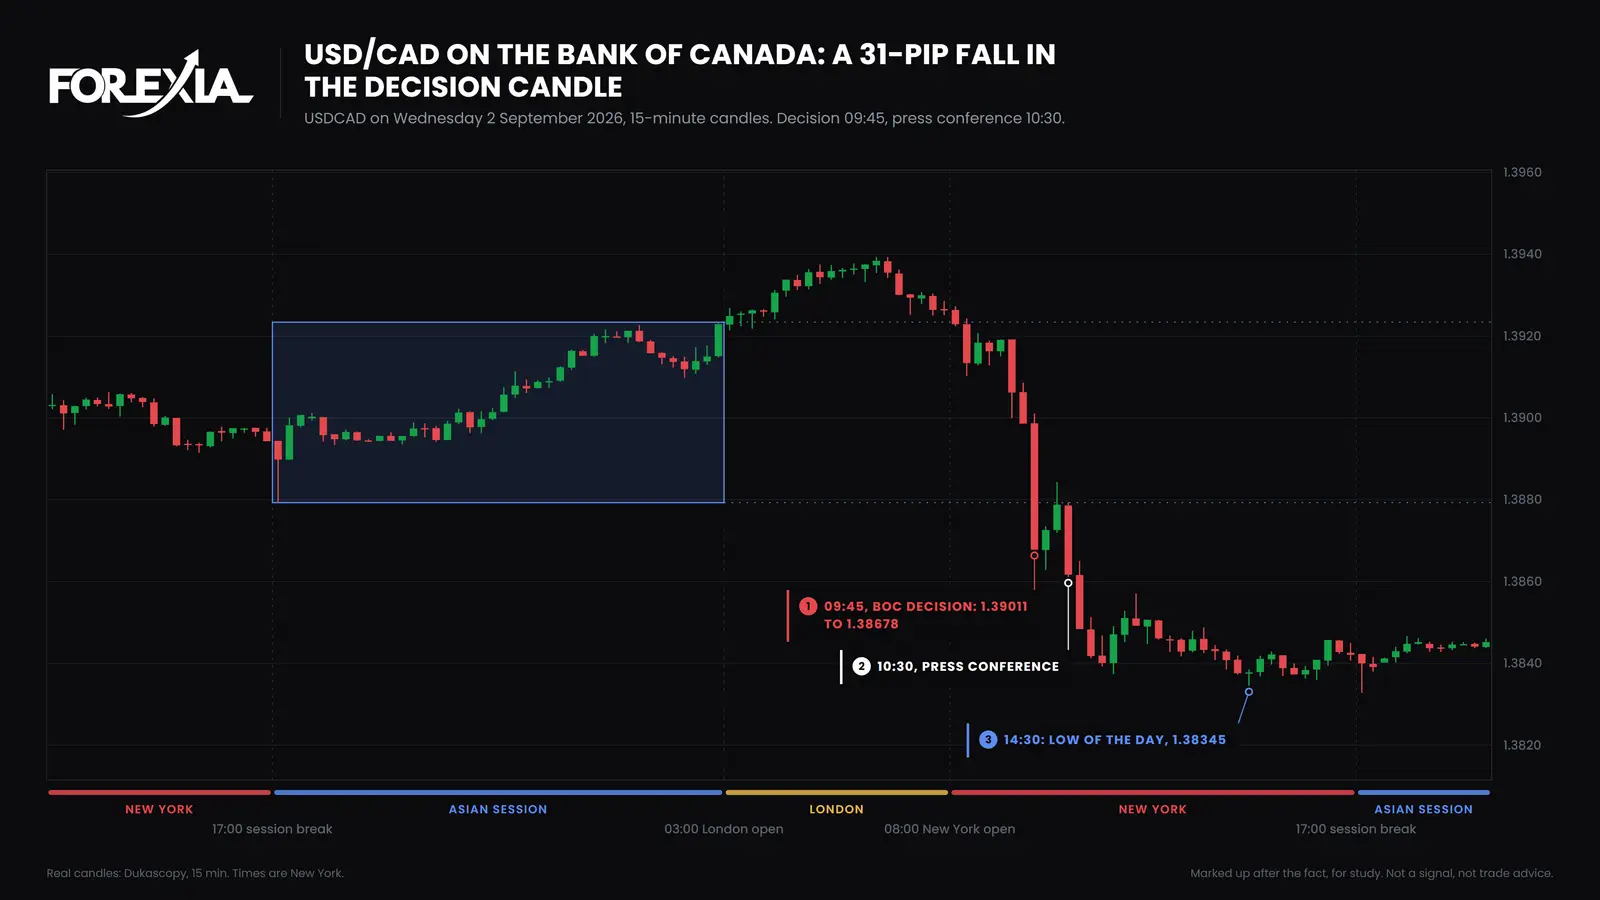
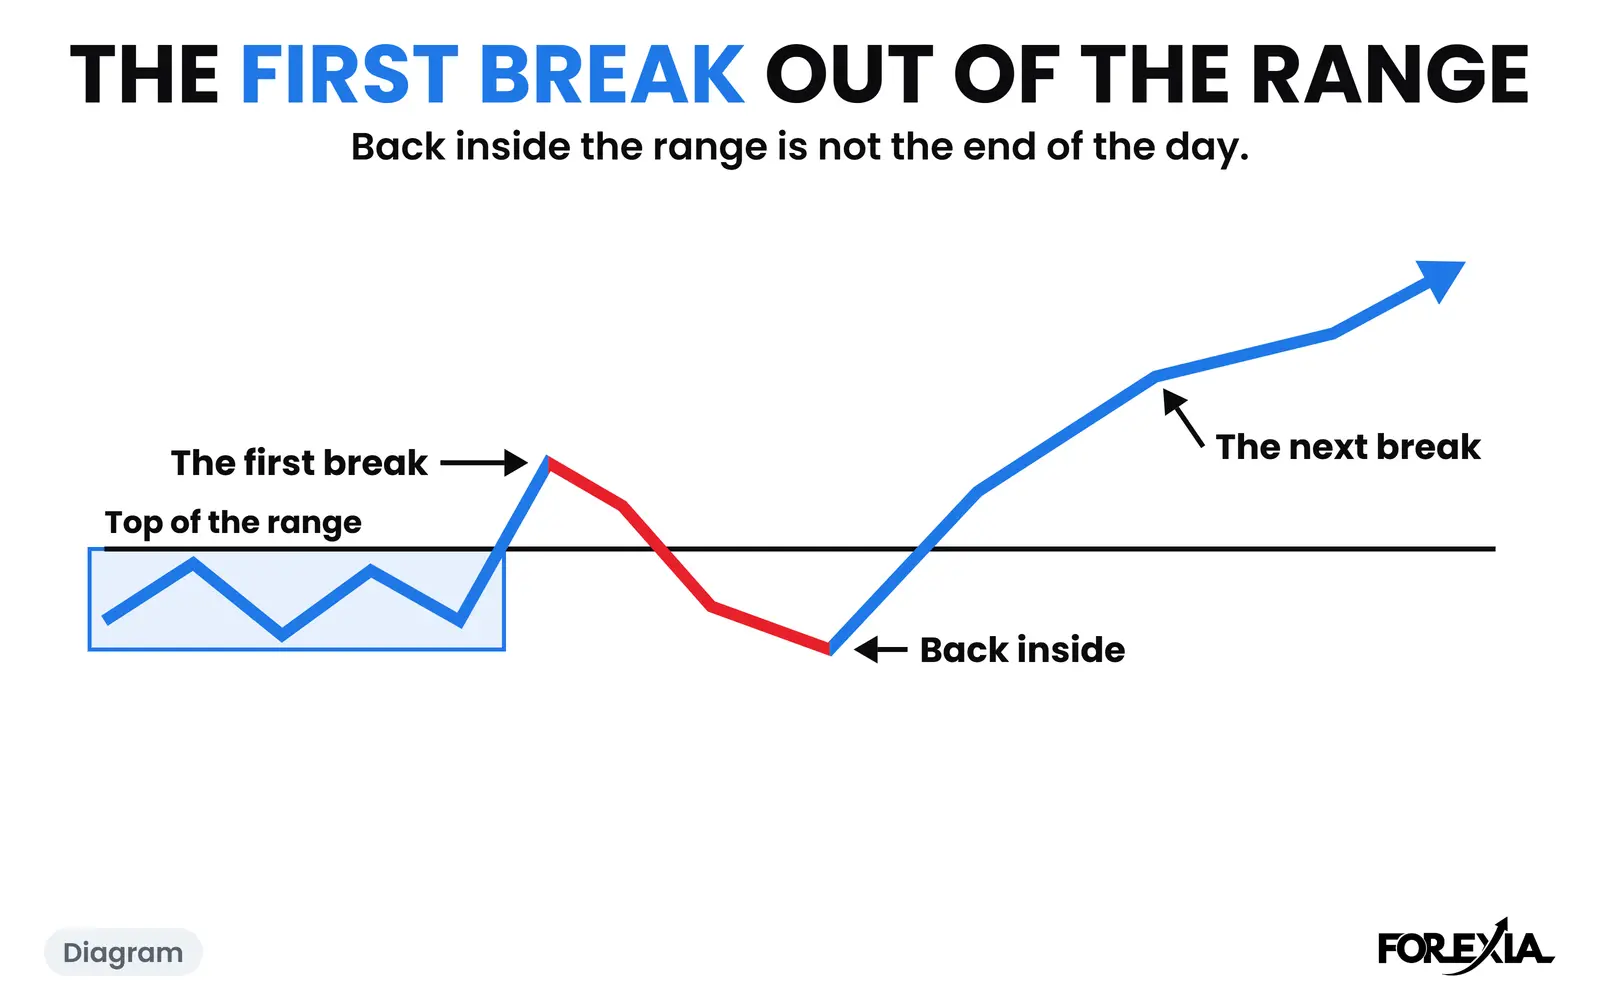
The break came at 07:30. That candle ran to 0.69492, 2 pips past the Asian high, and closed at 0.69483, 1 pip over it. It looked like the break the pair had been working towards for three hours. The 07:45 candle closed at 0.69447, back under the line, and price fell 36 pips to 0.69128 by 16:15. Times are New York, and the candles are 15-minute Dukascopy, so your broker's chart may differ by a pip or so. Our calendar shows no medium or high-impact release for either currency near it.
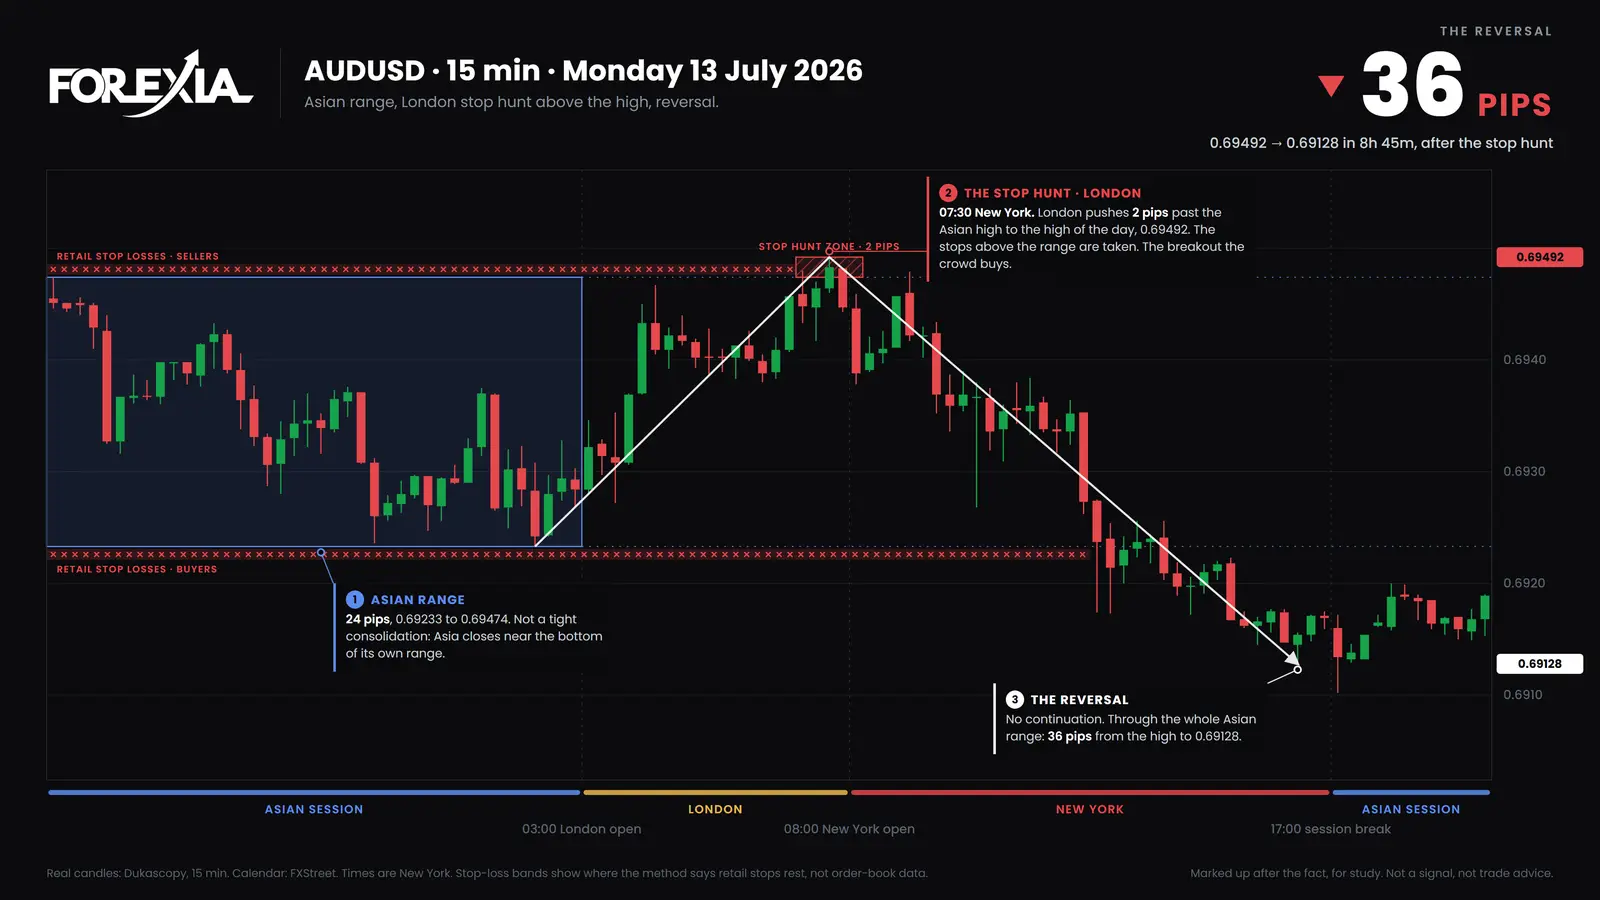
Two pips was all the break needed to be, and for a buyer entering on it, a stop just back inside was a stop in the same pile. A break that small shows why we call it a pool and not a line. The breakout buyers' entries and the sellers' stops came to the same price, and the price went there once.
Does it happen in the New York session too? GBP/USD, 6 August 2026
Yes. On Thursday 6 August 2026, GBP/USD had an Asian range of 17 pips, 1.34546 to a high of 1.34721. London and the morning stayed inside it. At 09:30 New York the candle ran to 1.34755, 3 pips past the high, and closed at 1.34739, over the line. The 09:45 candle reached 1.34790, 7 pips past, and closed at 1.34770. That is two closes in a row beyond the level.
The 10:00 candle opened at 1.34773, reached 1.34790 again and closed at 1.34667, 5 pips back under the Asian high. That was the first close back, and it came on the next candle after the highest one. Price fell 31 pips to 1.34481 by 16:15. Our calendar shows only a claims-and-productivity release at 08:30, an hour before the first close over the line.
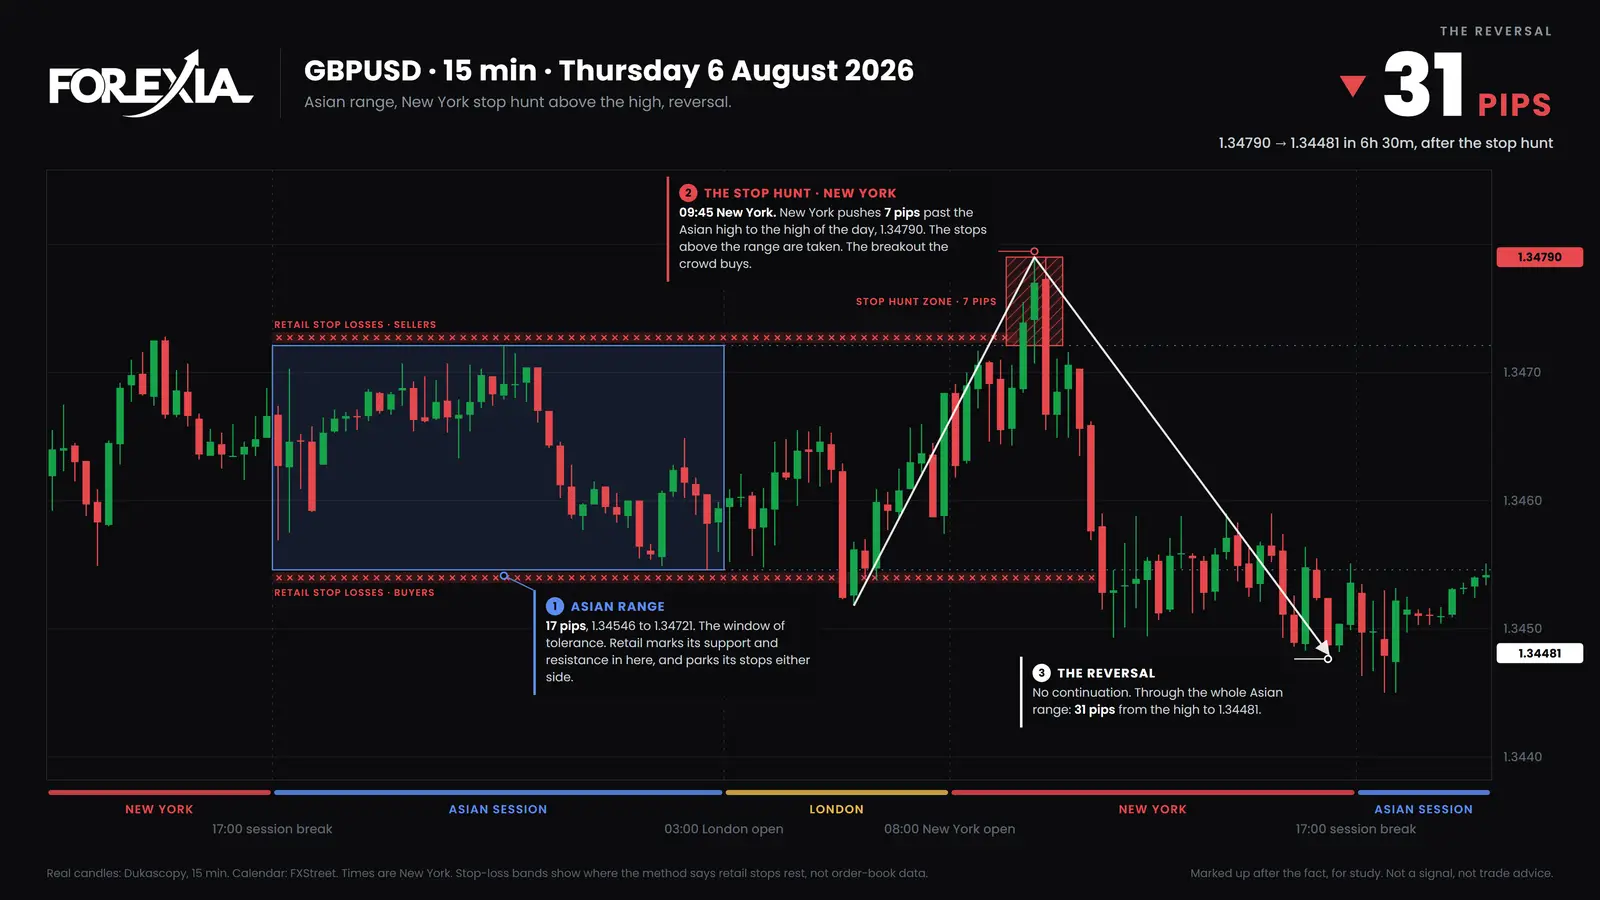
Two closes in a row over a level is what a traders' rulebook calls confirmation. It did not hold here. We picked these two days because they reversed, and a reversal seen afterwards is not a setup.
How often does a breakout fail?
Most breaks of the usual levels close back, and a minority stay. We counted every time an edge of the Asian range, or the previous day's high or low, was traded through after the London open by at least 3% of the average daily range, on seven dollar majors and gold, from 6 April to 1 October 2026. A level Asia had already passed is left out. "Closed back" means a 15-minute candle closed on the near side of the line by 17:00 New York.
| Levels | |
|---|---|
| Taken after the London open | 1,601 |
| Closed back the same day | 1,310 |
| Never closed back by 17:00 | 291 |
The median trip past the line was about 9% of the day's average range when it closed back, and about 65% when it did not. So a break that fails usually fails shallow, and a break that stays runs a long way.
You will see pages say that half or more of all breakouts fail, or 60% to 70% in a given session. None of those we found gives a method, so we do not repeat them. Ours counts candles and not trades: a close back does not make the trade the other way pay, and our own test of that did not make money. The script is scripts/seo-counts.mjs, and it ends on 1 October.
What are the other reasons a breakout fails?
The usual list is real, and it sits beside the orders and not instead of them.
- Thin liquidity. A move in a quiet hour has less behind it, and orders are easier to run through.
- A scheduled release. Everyone knows the minute, and orders gather around it. We call that News-Induced Liquidity.
- A level that is too clean. The Third Tap is the perfect third touch that makes a level look safe, and more orders sit behind it.
- No demand. The break came on nothing, and nothing followed it.
The chart cannot say which of these did the work. That is also why the stop hunt vs fakeout page sorts the words by what each claims, and the bull trap and its mirror shows one each way.
How do you tell a real breakout from a failed one?
Not while the candle is open. A candle that closes back inside the level is the sign the break failed, and it can come at once or hours later. If none comes, the break stayed, and whoever bought it was right. Those 291 levels ran a long way.
If your own stop was the one that went, stop too tight or stop hunt runs the check on that loss. If it keeps happening, start with why your stop loss always gets hit, and why price hits your stop and then reverses walks through one full day. A late chase of a break is the Second Leg Climax when it runs past the first push and turns. For the wider picture, start with stop hunting in forex.
What this does not tell you
Two days are examples and not a sample. We chose them because they reversed. We have no count of how many failures came from the orders and how many from no demand, and no chart could produce one.
Nor does knowing why a breakout fails make the next trade pay. Traded against each flagged hunt on seven dollar majors and gold, our own fixed rule lost money after costs in every year from 2021 to 2026, between -0.10R and -0.23R a trade, where R is the amount risked on one trade. That is one rule on one data source, and it cannot see order flow.
Course 3 of ForexiaPRO, Reverse Price Action, teaches this read step by step from lessons 3.1 and 3.2.
Frequently asked questions
Why do breakouts fail?
A breakout needs fresh buyers, but the break itself brings its own: breakout traders entering, and sellers' stops, which are buy orders. All of those orders sit past the level, and once they are filled there may be nobody left to push price further. That is our read of the orders, and it is not the only cause. A breakout can also fail because the move simply had no demand behind it.
Why do my breakouts keep failing?
Probably because you are buying the same place everyone else is told to buy. A clean level draws entries and stops to one price, and that makes it a place price can go to and come back from. Some breaks do stay: in our count of 1,601 levels taken, 291 never closed back. Telling them apart in advance is the hard part, and the close is the only test we have.
How often do breakouts fail in forex?
Of the 1,601 times an edge of the Asian range or the previous day's high or low was traded through after the London open, 1,310 closed back by 17:00 New York the same day and 291 did not. That counts candles and not trades, and it is one six-month sample on eight markets. Pages that say 50% to 70% of breakouts fail do not show their method.
Is a failed breakout the same as a stop hunt?
On the chart, yes: a break and a close back. A stop hunt adds a purpose, that price went to take the stops past the level, and no chart can show that. We read a failed break as a stop hunt and say it is a read.
How do you tell a real breakout from a failed one?
Not while the candle is open. A candle that closes back inside the level is the sign it failed, and that can come on the same candle or hours later. On GBP/USD on 6 August 2026 the first close back came 15 minutes after the highest candle. On AUD/USD on 13 July 2026 it came 15 minutes after the break.