Why Is Gold Going Up? Explained From the Market Maker's Seat
Forexia Academy9 min read
Why is gold going up? The latest rise on our chart came on Wednesday 4 November 2026: 130 pips from the day's first candle to its last, with the 10-year yield and the dollar index both lower by the close. So the usual causes fit that day, but they fit loosely. Below are the check you can run on any day, the usual causes and three older rallies, one that began at a time no scheduled release explains.
This page was written on 11 November 2026 and is not a live report, so it names no live price. On gold we count $1 as 1 pip. All times are New York, and chart prices are Dukascopy's bid. For the wider picture, start with our guide to how to trade gold. The opposite question has its own page, why gold is falling.
Why did gold go up on 4 November 2026? The latest rise
Gold opened the day at 3930.76 and closed at 4061.07, 130 pips higher, the tenth-largest one-day rise in our candles, which start on 29 December 2025. Its low came at 19:30 on Tuesday at 3919.63, and its high at 13:00 on Wednesday at 4070.28.
Most of the rise came before London opened. The Asian range, from the 17:00 break to 03:00, ran from 3919.63 to 4029.00, 109 pips. The 00:30 candle alone went from 3956.86 to a high of 3989.66, and gold was at 4029.00 by 02:00. After that it crept up another 41 pips to the high.
| Check | What the data says on 4 November |
|---|---|
| Yields | The 10-year real yield went from 2.65% to 2.64% and the 10-year Treasury from 4.95% to 4.90%, both lower, as end-of-day readings |
| The dollar | The Fed's broad dollar index went from 121.81 to 121.40, lower, and EUR/USD gained 36 pips |
| The calendar | Not checked: our stored calendar does not yet cover the week of 2 November, so we name no release |
| The chart | A run from the Asian lows, without a push through a high and a close back |
| Say if nothing fits | The yield move is 1 basis point, so it is a weak fit. We name no cause |
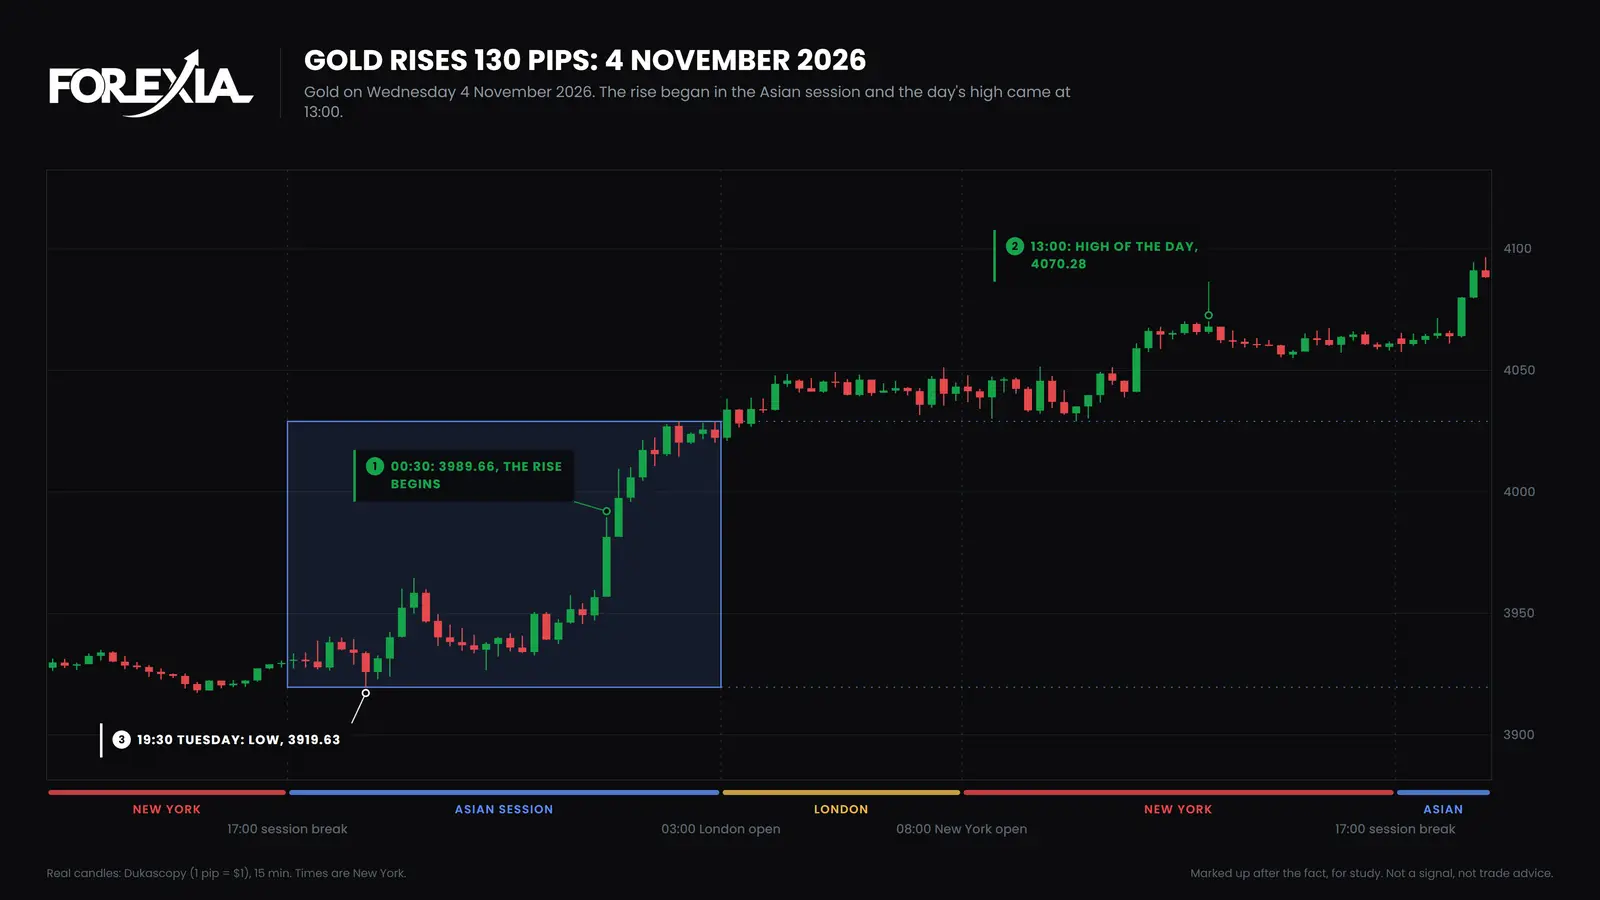
The dollar fell and yields eased, and the direction agrees with gold. A 1 basis point move in a real yield is small next to 130 pips, though, and end-of-day figures cannot show what happened inside the day. So the data points the right way and still explains little.
What makes gold go up?
Gold pays no interest and is priced in dollars, so most rises come back to what else a holder could own, what the dollar is doing and who is buying. These are the usual causes and where to look at each.
| Cause | Why it pushes gold up | Where to check | How fresh |
|---|---|---|---|
| Real yields fall | A Treasury pays less after inflation, so holding gold costs less | 10-year real yield | Next business day |
| The dollar weakens | Gold costs less in every other currency | EUR/USD on any chart; the Fed's broad dollar index | Live; about a week late |
| Futures funds buy | Leveraged buyers add quickly | CFTC Commitments of Traders, and our gold COT page | Weekly |
| Gold funds buy | Metal flows into ETF holdings | World Gold Council ETF flows | Weekly |
| Central banks buy | Official holdings rise | World Gold Council's monthly statistics | Weeks late |
| Fear rises | A safety bid arrives on a crisis | The news; no clean number | Live |
A real yield is the Treasury yield after expected inflation. That is why the plain yield can mislead: if it falls only because expected inflation fell, the real yield has not moved.
Central banks are the cause most often quoted for rises over months and the least useful for a day. The World Gold Council's first-quarter 2026 report first put net purchases at 244 tonnes, and its second-quarter report cut that quarter to 57 tonnes. Figures that arrive weeks late, and are revised that hard, cannot be matched to one candle.
Three older rallies, checked against the data
A month is easy to explain afterwards. A day is the real test. Here are three rallies on our gold chart beside the same day's data. A rise runs from the day's first candle to its last, and each change is from the previous business day's reading.
| Day | Gold, pips | 10-year real yield | 10-year Treasury | Broad dollar index | EUR/USD, pips |
|---|---|---|---|---|---|
| Wed 19 Aug 2026 | +190 | 2.41 to 2.35 | 4.71 to 4.65 | 118.98 to 118.33 | +103 |
| Wed 5 Aug 2026 | +171 | 2.40 to 2.41 | 4.63 to 4.63 | 119.60 to 119.39 | +23 |
| Thu 11 Jun 2026 | +143 | 2.21 to 2.16 | 4.55 to 4.45 | 119.91 to 120.12 | +43 |
19 August: everything agreed, and the first move came at 08:30
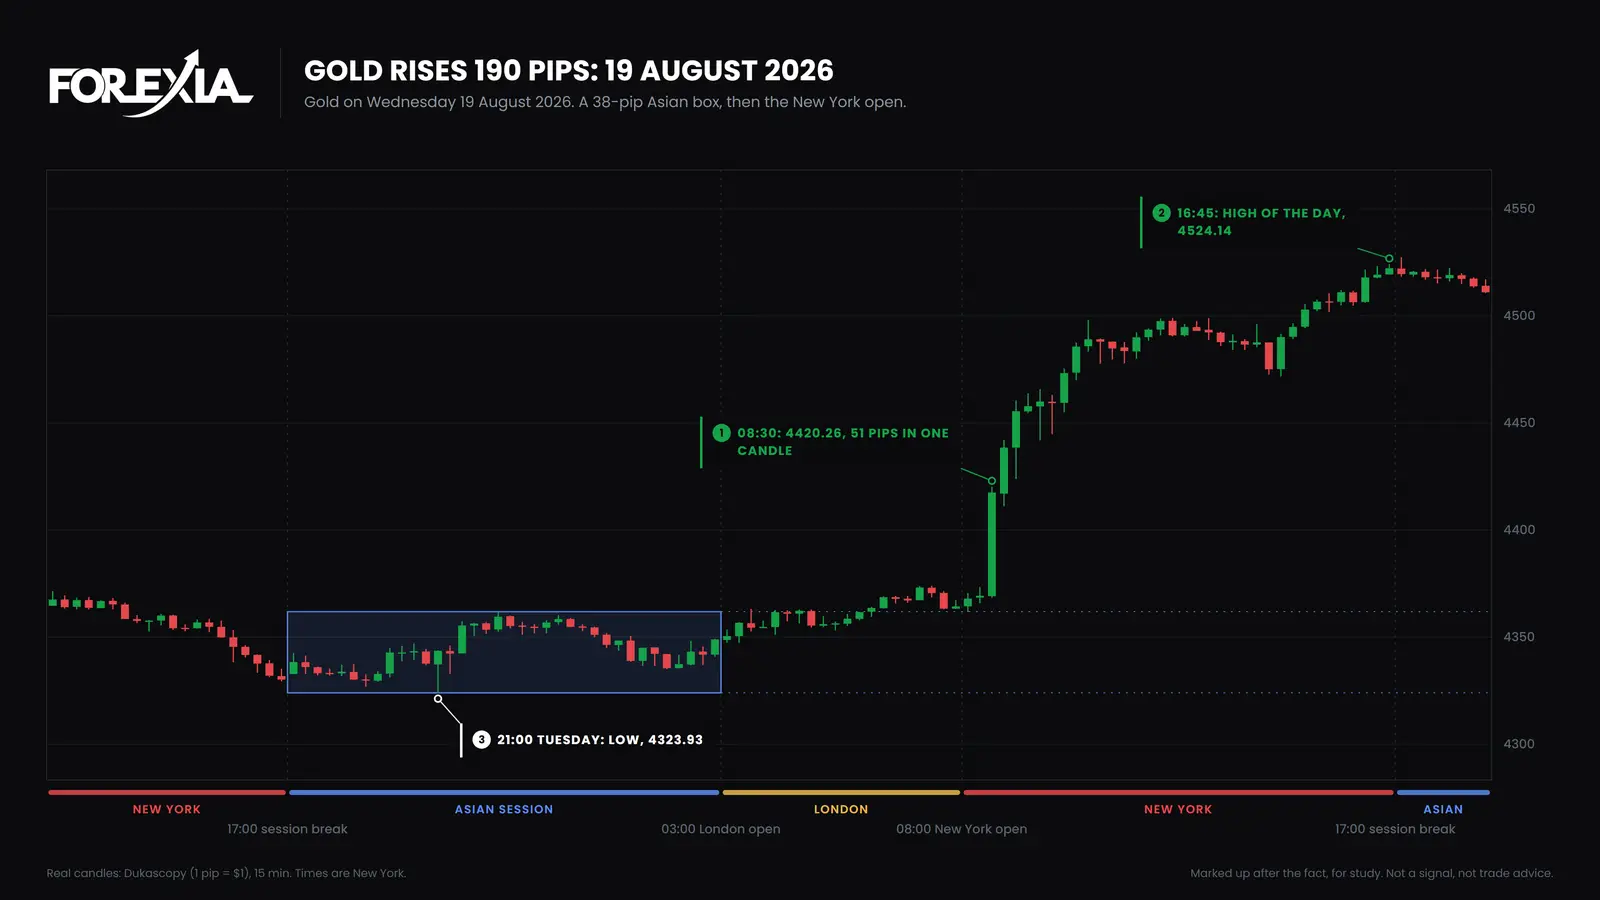
The real yield fell 6 basis points, the dollar index fell and EUR/USD rose 103 pips. The data lines up. The timing is less tidy. Gold's Asian range was only 38 pips, 4323.93 to 4361.85. UK inflation came out at 02:00 and gold's candle closed at 4337.32, almost unchanged, and Lagarde spoke at 03:10 without a visible effect. The jump came at 08:30, when gold went from 4369.09 to 4420.26, 51 pips in one candle, and it reached 4460.45 by 09:00.
Our stored calendar lists nothing of medium or high impact for the dollar at 08:30 that day. The FOMC Minutes, high impact, came at 14:00, by which time gold had already risen 154 pips from the day's open. So the calendar does not explain the start of the move, and the data does not say what did. The high came at 16:45, at 4524.14.
5 August: yields did not move, and most of the rise was overnight
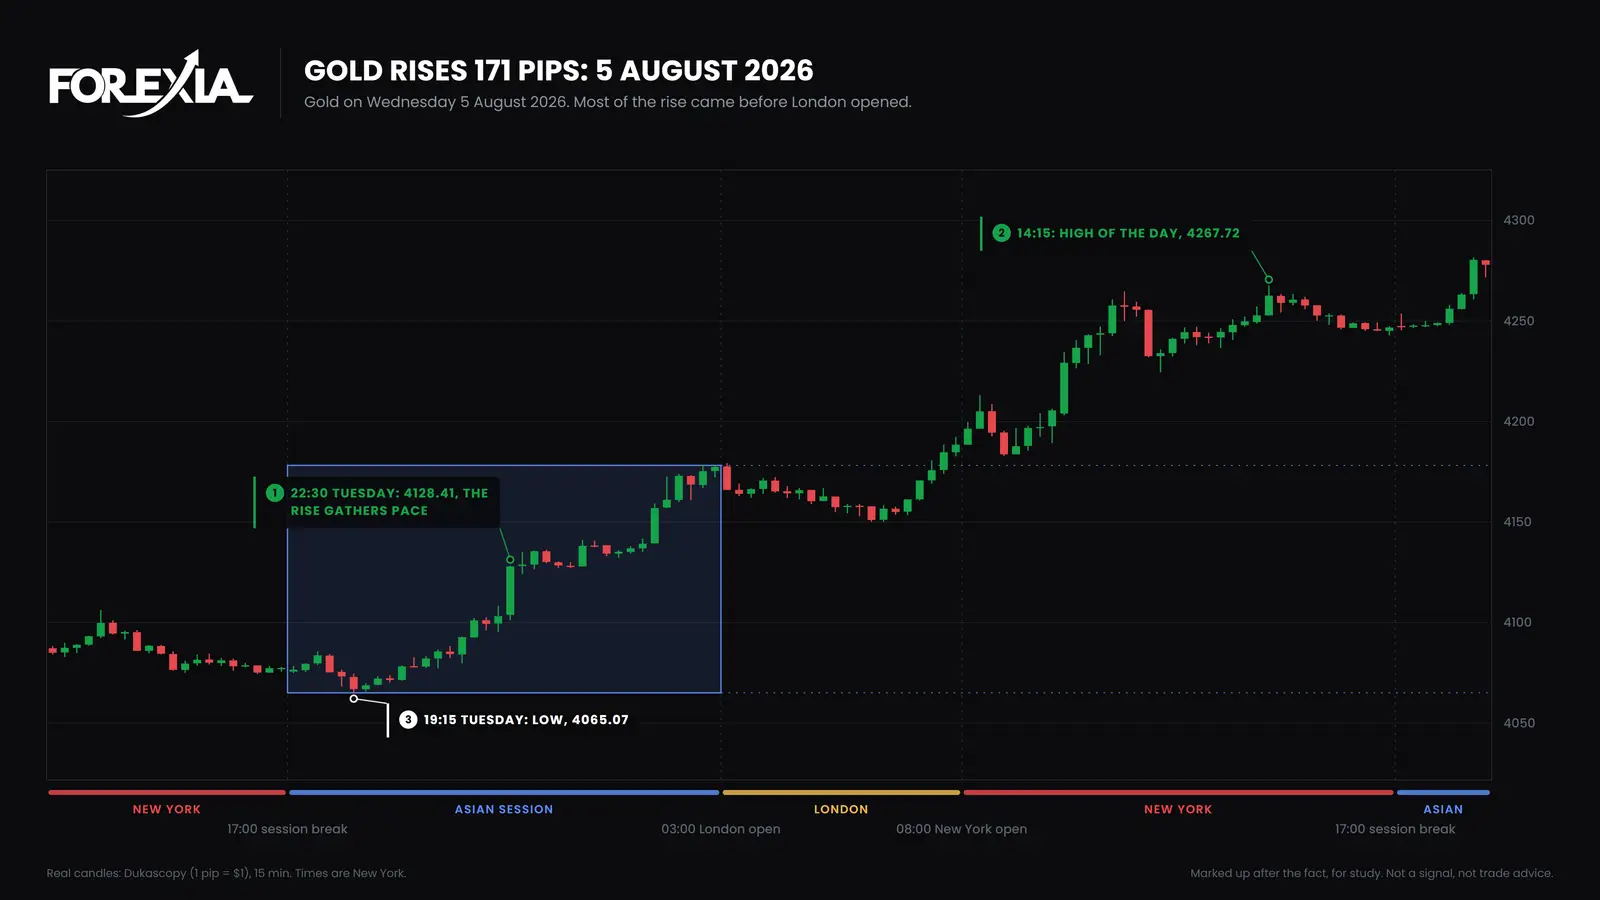
Here the real yield was flat and the 10-year Treasury unchanged to two decimals. The dollar index fell a little, and EUR/USD gained only 23 pips. Gold opened at 4075.66 and the 08:00 candle opened at 4188.49, already 113 pips higher, before the day's US data. Most of that came in two bursts, at 22:30 on Tuesday, when the candle high reached 4128.41, and from 01:30 to 02:30, when gold went from 4139.41 to a high of 4177.99.
The high-impact ADP report at 08:15 and ISM Services PMI at 10:00 followed, and gold added 58 pips more by the close, with its high of 4267.72 at 14:15. We do not know what made the earlier 113 pips. The Fed speakers on our calendar that evening, Schmid at 20:00 on Tuesday and Kashkari at 08:00, were medium impact and do not sit at the bursts.
11 June: a flat morning, then 94 pips in half an hour
On 11 June the dollar index closed higher, 119.91 to 120.12, while gold rose 143 pips, so the dollar did not lead this one. Yields fell, the real yield by 5 basis points. The ECB decided at 08:15 and US producer prices came at 08:30, but gold stayed in a narrow band: the 08:30 candle closed at 4073.11, 5 pips over its open. At 13:15 gold was at 4075.82, and the 13:30 candle ran to 4169.69, 94 pips above that open. It reached 4219.85 at 15:30.
Our calendar lists nothing between 13:00 and 14:00. So the scheduled events fall where gold was quiet, and the move came where none is listed. Yields fit the direction, but a daily yield cannot place a burst in a half hour.
Why does gold go up, from the market maker's seat?
We read a day from three seats, the crowd's, the market maker's and the observer's, which the glossary calls the three seats. The headline belongs to the crowd's seat: it says what traders were told. The market maker's seat asks where orders rested. A rise can run through sell stops above a recent high, and those stops, which are buy orders once triggered, can feed a rise that a headline later explains.
We do not claim that for any day on this page. None of the three rallies above was a push through an obvious high followed by a close back, which is the shape we read as a stop hunt. They were runs, and for a run we say what the data shows and stop there.
Why is gold going up today? How to check
These six questions show what is moving gold. They are for reading the day, and none of them is a signal to buy or sell.
- Yields. Has the 10-year Treasury yield fallen today? Any chart shows that live. The real yield comes out the next business day, so confirm it then.
- The dollar. Put EUR/USD beside gold over the same hours. Both rising points to the dollar. Gold rising alone points elsewhere.
- The calendar. Was there a US release in the minute the rise began? Compare the number with the forecast, and remember that gold on a Fed day, how NFP moves gold and how CPI moves gold have shapes of their own.
- The holders. Read the latest COT report and ETF flows. They are late, so they speak to the month and not the minute.
- The chart. Did the rise start after price pushed through an obvious high and closed back? If not, it is a run.
- Say if nothing fits. It is a real answer, and it is better than borrowing a reason from a headline.
How big can a one-day rise be?
The five largest one-day rises in our candles are 275 pips on 3 February 2026, 236 on 28 January, 190 on 19 August, 173 on 6 February and 171 on 5 August. Gold's own daily range is wide: the median day in our candles is 99 pips from high to low. So a 130-pip day, like 4 November, is large but not unusual.
What can this check not tell you?
It cannot tell you what gold does next. Every line of it explains a rise after it has started. The links are loose, as 5 August and 11 June showed, and end-of-day figures hide what happened inside the day. Four days are examples and not a sample, and we chose them afterwards.
It also gives no reason to buy. A rise seen afterwards is not a setup, and our own fixed rule of trading against hunts lost money after costs, as the stop hunt guide sets out.
Course 1 of ForexiaPRO, Reading the Map, teaches The Three Seats starting in lesson 1.1.2.
Tools for this
Frequently asked questions
Why is gold going up today?
This page is not a live report, so it cannot name today's reason. Check three things in order: did the 10-year Treasury yield fall, did EUR/USD rise over the same hours, and was there a US release at the minute the rise began. If none of them fits, the honest answer is that the public data gives no reason.
Why is gold going up when the dollar is going up?
It happens. On 11 June 2026 the Fed's broad dollar index closed higher while gold rose 143 pips on our chart. The dollar is one pull on gold and not the only one, and an end-of-day index cannot show what happened inside the day.
Does gold go up when yields fall?
Often, because gold pays no interest and a lower yield makes that matter less. On 19 August 2026 the 10-year real yield fell from 2.41% to 2.35% and gold rose 190 pips. On 5 August 2026 the real yield barely moved, 2.40% to 2.41%, and gold rose 171. So the link is loose, and two days do not make a rule.
Why does gold go up in a crisis?
Because some buyers treat it as a place to hold wealth when they are afraid. There is no clean number for fear, so a story about fear is the hardest cause to check, and we do not name it for a day we cannot source.
Will gold keep going up?
Nobody can say, and neither can this page. The causes here explain rises afterwards and do not forecast the next one. A rise that has already happened is not a setup.