COT Report NZD: The Crowd at Index 13, and a Low That Held
Dylan Forexia7 min read
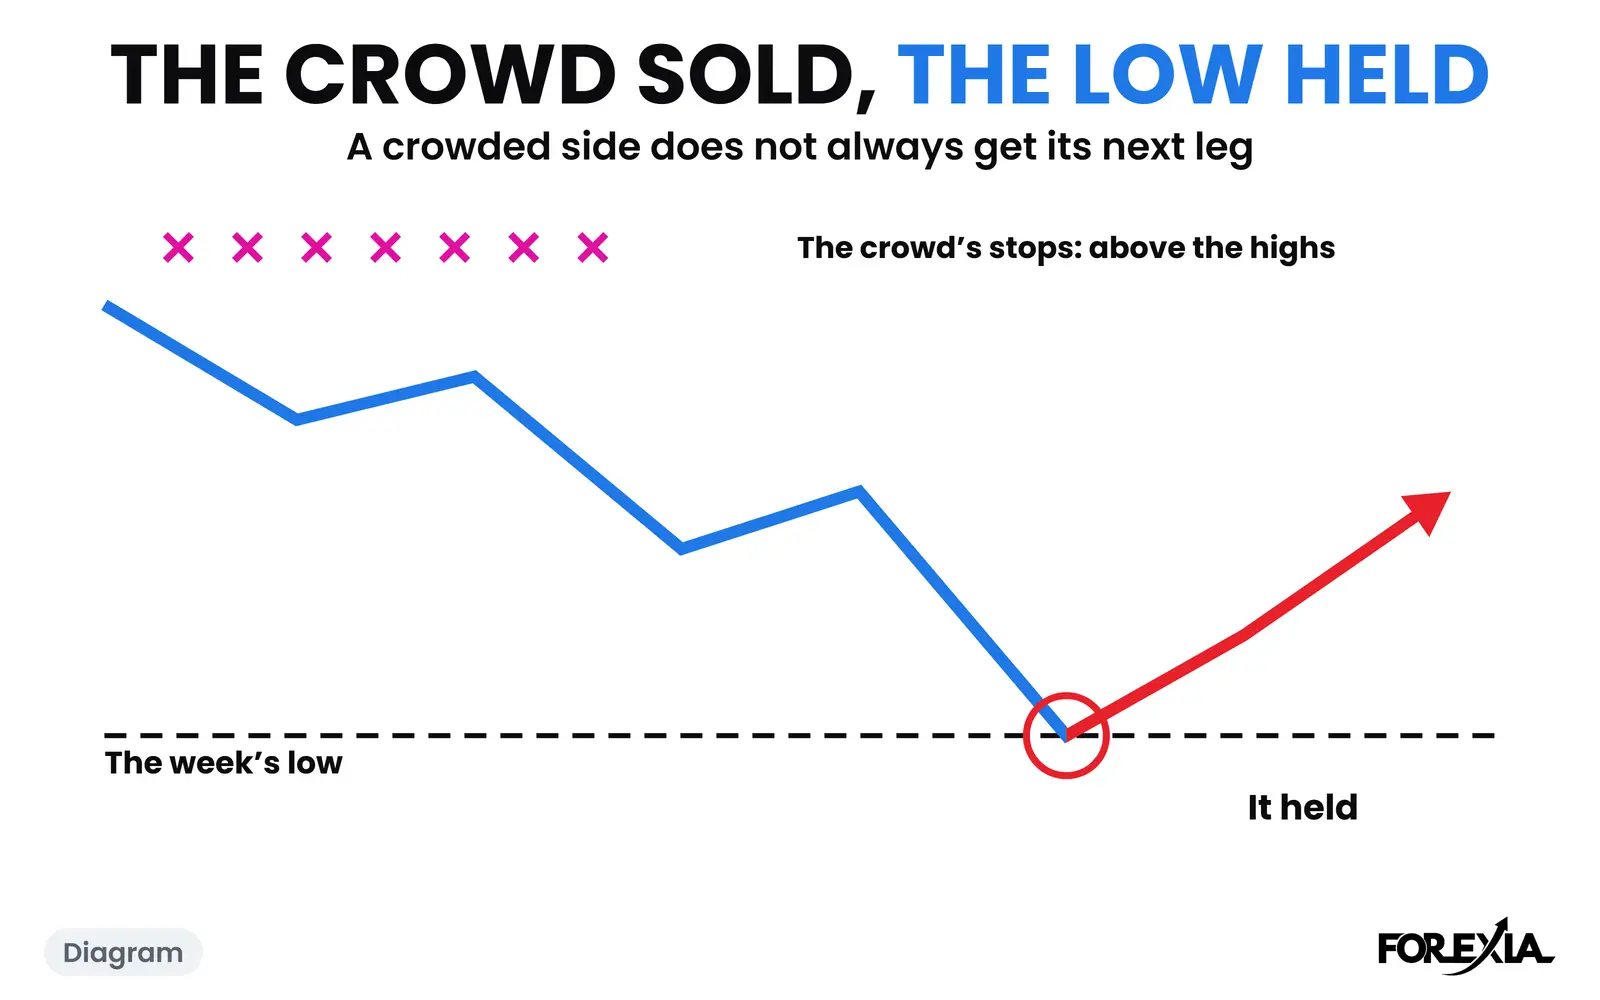
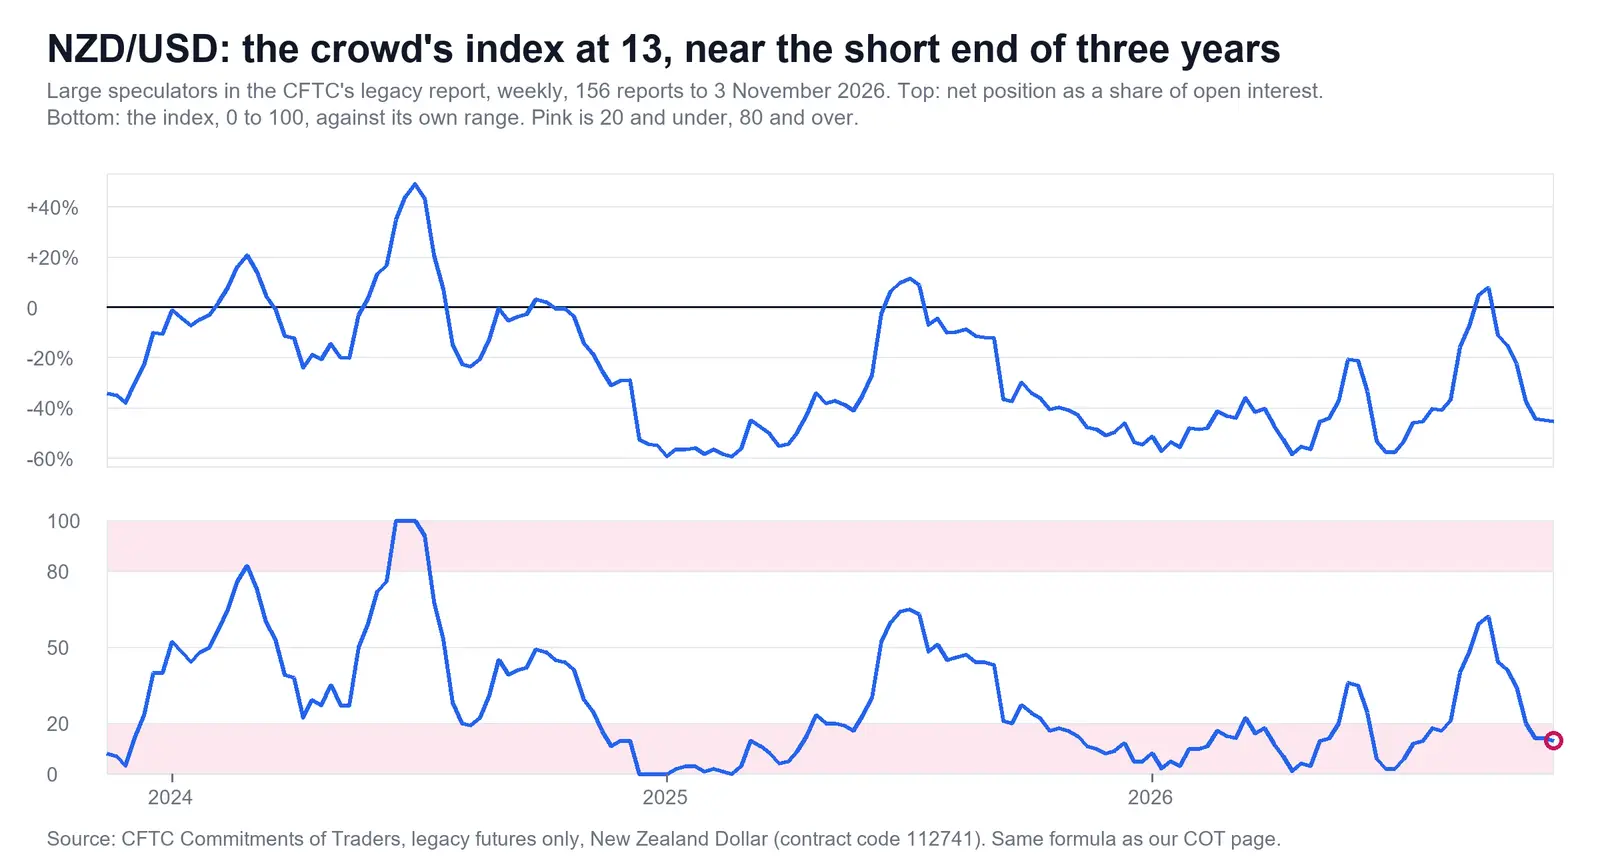
The COT report NZD traders read for the week published on 6 November 2026 had large speculators net short 60,015 contracts, index 13: crowded short, near the most short in three years. We read that as the side not to join. The nearest line on the crowd's side was the week's low, 0.55271, set that same Friday. It held on Monday 9 November, and the New Zealand dollar closed 91 pips above Friday's close.
This is one dated report. The guide to the Commitment of Traders report explains the groups and the formula, and what the COT report is in forex is the short version.
How did the COT report NZD read that week?
It read near the short end of the crowd's three-year range, and still above its floor. The contract is New Zealand Dollar at the Chicago Mercantile Exchange, code 112741, and it runs the same way round as the pair. The report was counted on Tuesday 3 November and published on Friday 6 November.
Here are the groups on that Tuesday, with open interest of 132,550 contracts. The first two rows are from the legacy report and the rest from Traders in Financial Futures, in the CFTC's public figures.
| Group | Net position | Share | Index |
|---|---|---|---|
| Large speculators (non-commercial) | −60,015 | −45.3% | 13 |
| Commercials | +62,729 | +47.3% | 87 |
| Dealers | +69,388 | +52.3% | 79 |
| Leveraged funds | −23,154 | −17.5% | 29 |
| Asset managers | −46,700 | −35.2% | 28 |
The first row is the crowd, with 18,469 contracts long and 78,484 short. Its share ran from 59.5% short on 25 February 2025 to 49.2% long on 2 July 2024, so 45.3% short was not the floor. The index is 13, not 0. In four weeks it added 21,317 short contracts and let 9,352 long contracts go.
Two things stand out. The first is that price agreed with the crowd: the New Zealand dollar fell 0.7% over those four weeks, from 0.56216 to 0.55849. The crowd sold into a falling market. The second is that the groups lined up. Asset managers and leveraged funds were both net short, and both sat in the lower third of their own ranges. So on this Tuesday "the funds" was one side, which was not true of the Australian dollar's report a week earlier.
Do not read the dealers' +69,388 as a bet. They make the market, and their position is mostly the other side of what others want. The commercials' index of 87 is a hedging group at the top of its own range, which says nothing here about direction.
At index 13 on 3 November we read the crowd as the side not to join, which is Fade the Crowd. So that report ruled out selling with it. It did not make a buy.
Which level mattered on NZD/USD?
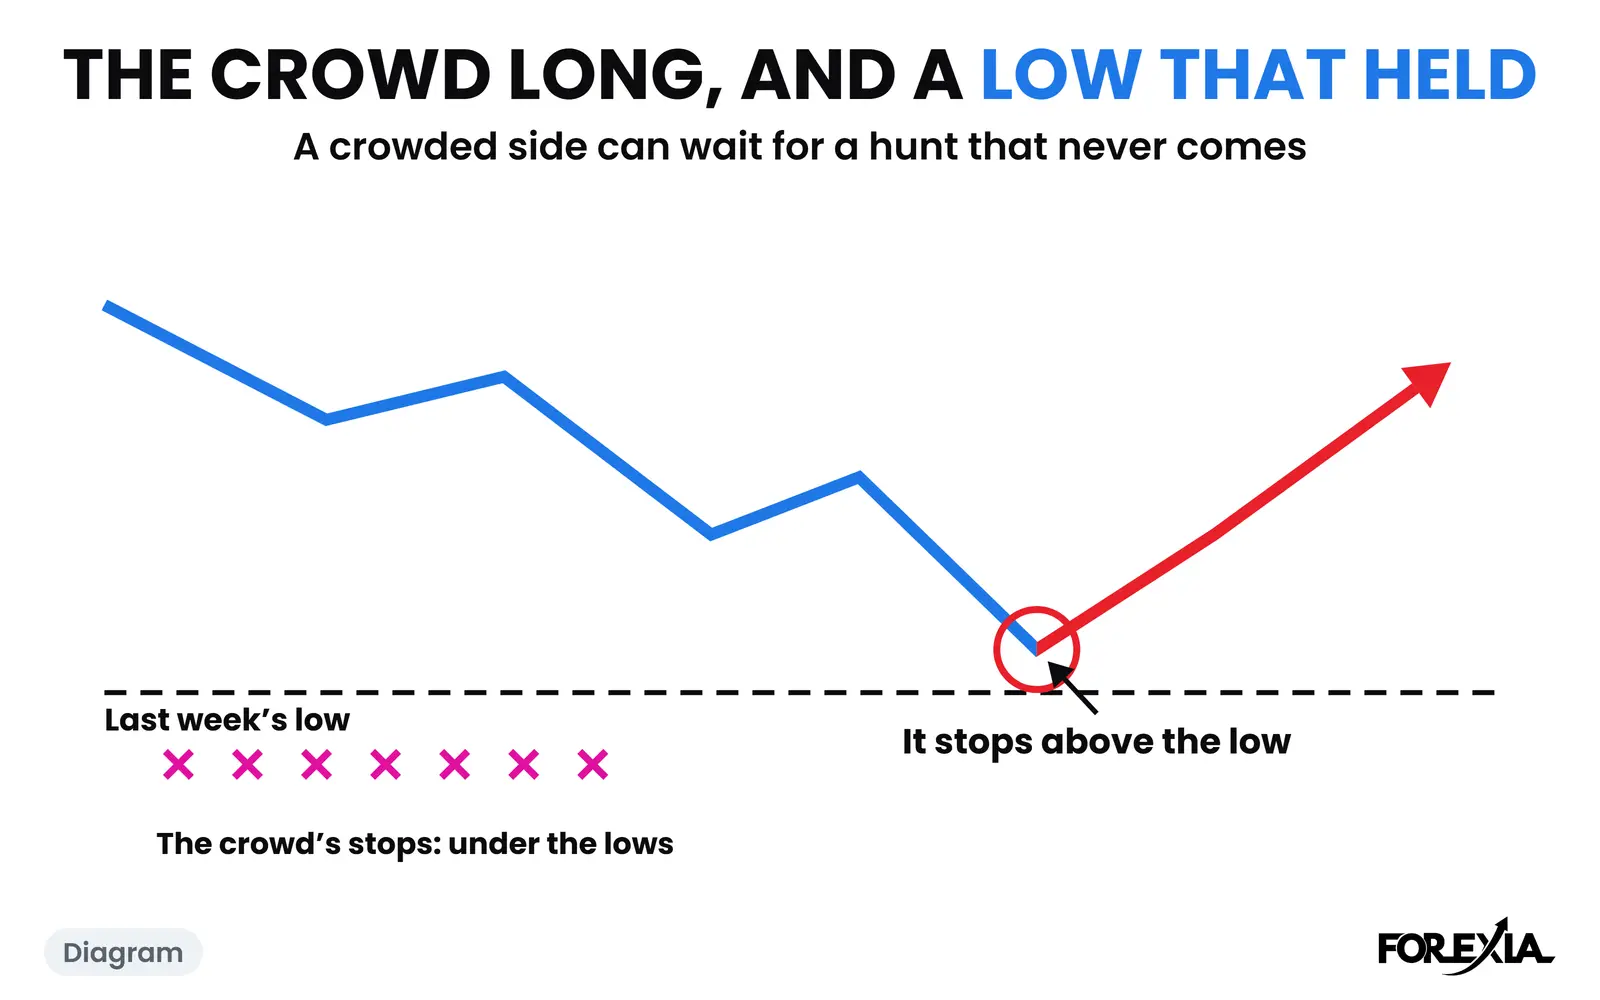
The week's low, because it was the nearest line on the side the crowd was selling. We read each short as a stop above the highs, and under that low we read the stops of anyone who bought, and the orders of anyone waiting to sell a break.
At Friday's close the New Zealand dollar was at 0.55398, and the week's low was 0.55271, set at 09:15 New York that morning. The report holds no stop orders, so all of this is a reading of the structure.
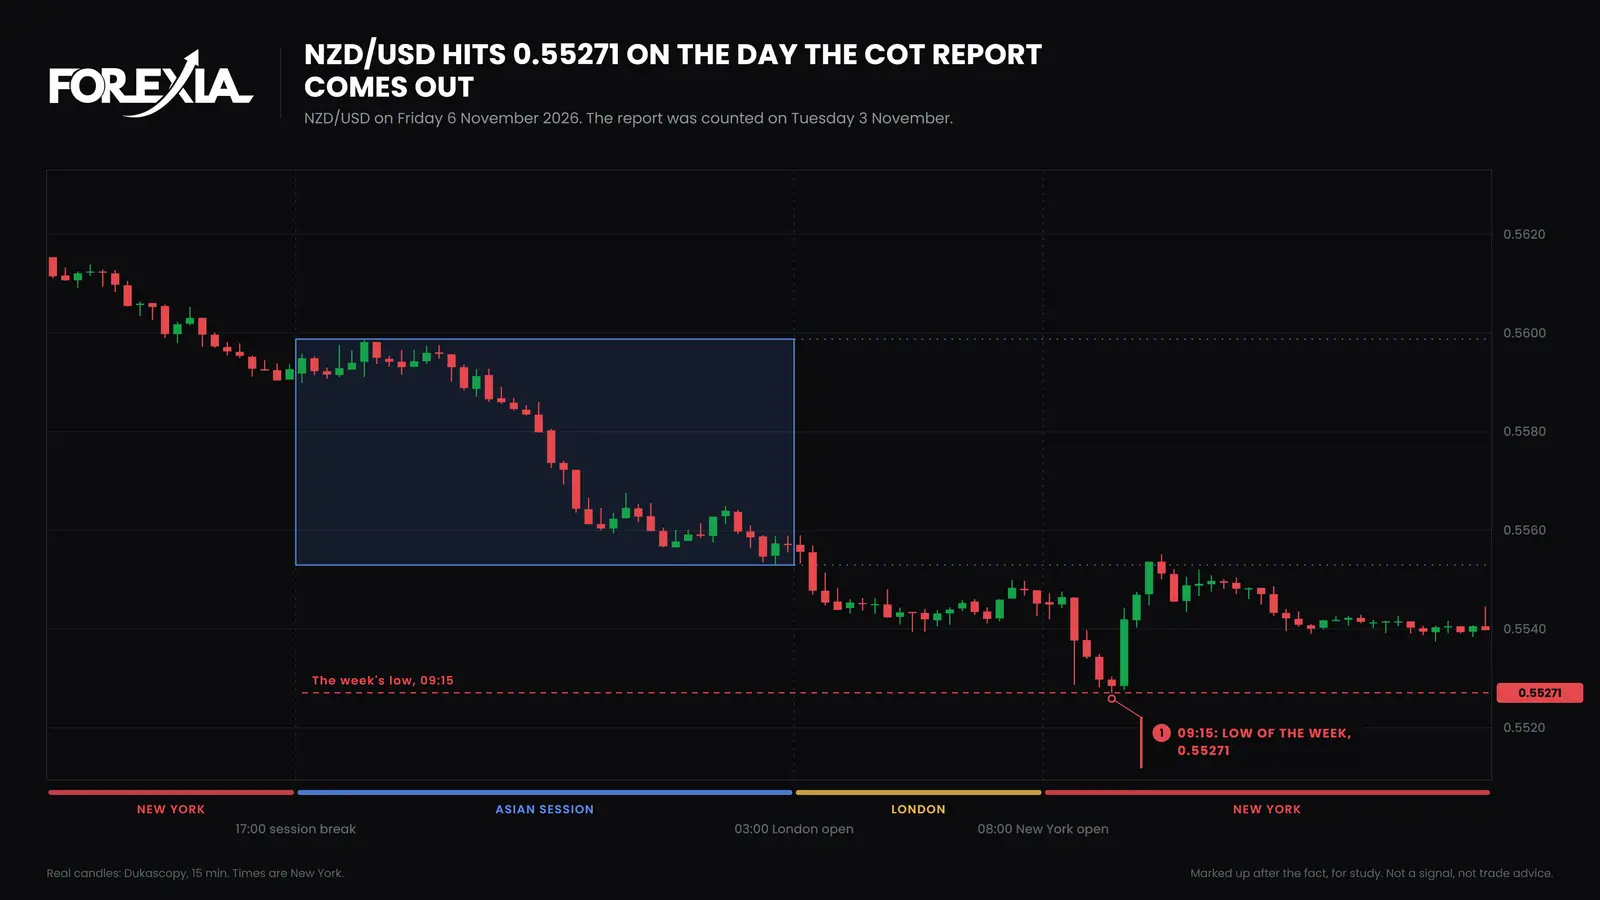
What a member does with that level stays in the course. Here is only what price did with it.
What did NZD/USD do after the report?
It did not lose the low on the first full day. On Monday 9 November the lowest price of the day was 0.55536, the first candle of the session, 26 pips above 0.55271. Price then rose to 0.56376 at 15:15 New York and the day ended at 0.56308. That is 91 pips above Friday's close.
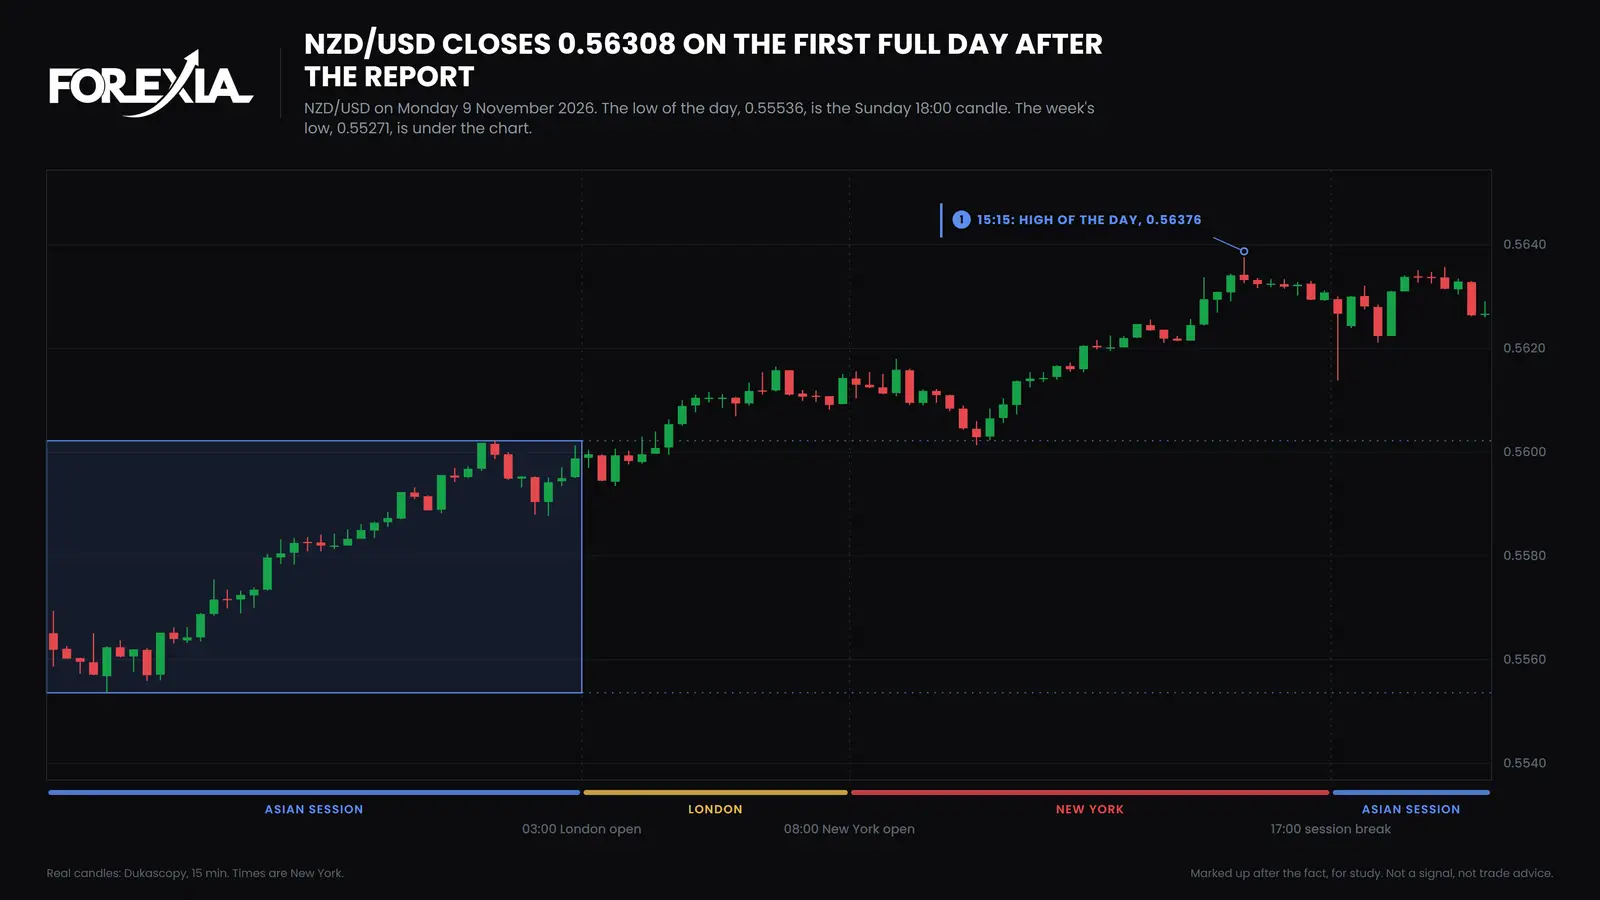
This is the opposite of the report on the Australian dollar, where price went under the low and kept falling. Here the low was tested and kept. We read it as a crowd that sold into a low and had no stop hunt to follow it, so there was no Close Back to wait for.
Read that with care. This is one trading day, not a trend: only one full day had passed since the release when this page was written. It does not say the crowd was wrong, since the report never said when. Run as a mechanical rule, trading against a hunt did not make money in our own test, and many moves reverse again. In our test of the report, joining a crowded side lost, and fading it is promising and not proven. The reports after 3 November are not part of this page's figures.
How has the New Zealand dollar's crowd moved through 2026?
It slid from the upper half of its range to the short end in seven weeks. Our index reads the crowd against its own 156 weeks, and each row here is a Tuesday count.
| Report counted | Net position | Share | Index | NZD/USD at Tuesday's close |
|---|---|---|---|---|
| 15 September | +10,518 | +7.8% | 62 | 0.57571 |
| 22 September | −11,380 | −11.2% | 44 | 0.57285 |
| 29 September | −17,315 | −15.1% | 41 | 0.56402 |
| 6 October | −29,346 | −22.6% | 34 | 0.56216 |
| 13 October | −47,001 | −37.6% | 20 | 0.56115 |
| 20 October | −58,149 | −44.2% | 14 | 0.56834 |
| 27 October | −57,690 | −44.7% | 14 | 0.56803 |
| 3 November | −60,015 | −45.3% | 13 | 0.55849 |
Those from before 2 October were built afterwards, by the same rules. In the 156 reports to 29 September 2026 this crowd was crowded short 74 times and crowded long 5 times, net long in only 23, and its longest run on one side was 23 reports, short, from 19 November 2024. So net short is the normal state, and crowded short is the usual one. The long end is the rare one. For a market's row worked column by column, see how to read the COT report.
What did each seat read in the New Zealand dollar's report?
The same table reads three ways, from the three seats.
- Retail sees every speculative group short and a weak New Zealand dollar, and sells. On Monday 9 November that seller was not paid, and a reader can take one day as proof that the report works.
- The market maker, as we read it, sees a crowd with stops above the highs, and commercials and dealers long.
- The observer sees which side is ruled out, and notes that price had fallen with the crowd for four weeks. It does not see when, and it cannot tell a low that holds from one that does not.
What do traders get wrong about the New Zealand dollar's COT report?
Three errors recur on this market.
- Thinking index 13 means a fall. The pair rose 91 pips on the first full day after the release.
- Calling a short net position extreme by its size. On this market the crowd was net long in only 23 of 156 weeks, and the index asks where it is against its own range.
- Reading one day as a verdict. A low that held on Monday says little about the weeks after it.
The yen's crowd, turned round, reads the other way: see the yen's report. The New Zealand dollar is not turned round.
Course 1 of ForexiaPRO, Reading the Map, teaches this read step by step in lesson 1.3.4, Reading This Week's Report.
Frequently asked questions
What contract is the New Zealand dollar's COT report?
New Zealand Dollar on the Chicago Mercantile Exchange, CFTC code 112741. It is quoted as dollars per New Zealand dollar, the same way round as NZD/USD, so it needs no turning round. The yen, franc and Canadian dollar futures do. It appears in both the legacy and Traders in Financial Futures reports.
What does an index of 13 on NZD/USD mean?
That the large speculators' net position, as a share of open interest, sits near the most short it has been in the last 156 weeks. On 3 November 2026 it was 45.3% short, and the range ran from 59.5% short to 49.2% long. We call 20 or under crowded short. It describes where they stand, not when price turns.
Are asset managers and leveraged funds on the same side in NZD?
Yes, on 3 November 2026. Traders in Financial Futures had asset managers net short 46,700 contracts, an index of 28, and leveraged funds net short 23,154, an index of 29, on one contract and one day. Dealers were net long 69,388.
How often is the New Zealand dollar's crowd crowded?
In the 156 reports to 29 September 2026 the crowd was crowded short in 74 weeks and crowded long in 5, and the longest run on one side was 23 weeks, short. They were net long in only 23 of the 156. This crowd spends most of its time net short, so a short reading alone is not news.