COT Report JPY: The Yen Futures Turned Round, and a Crowd at Index 83
Dylan Forexia7 min read
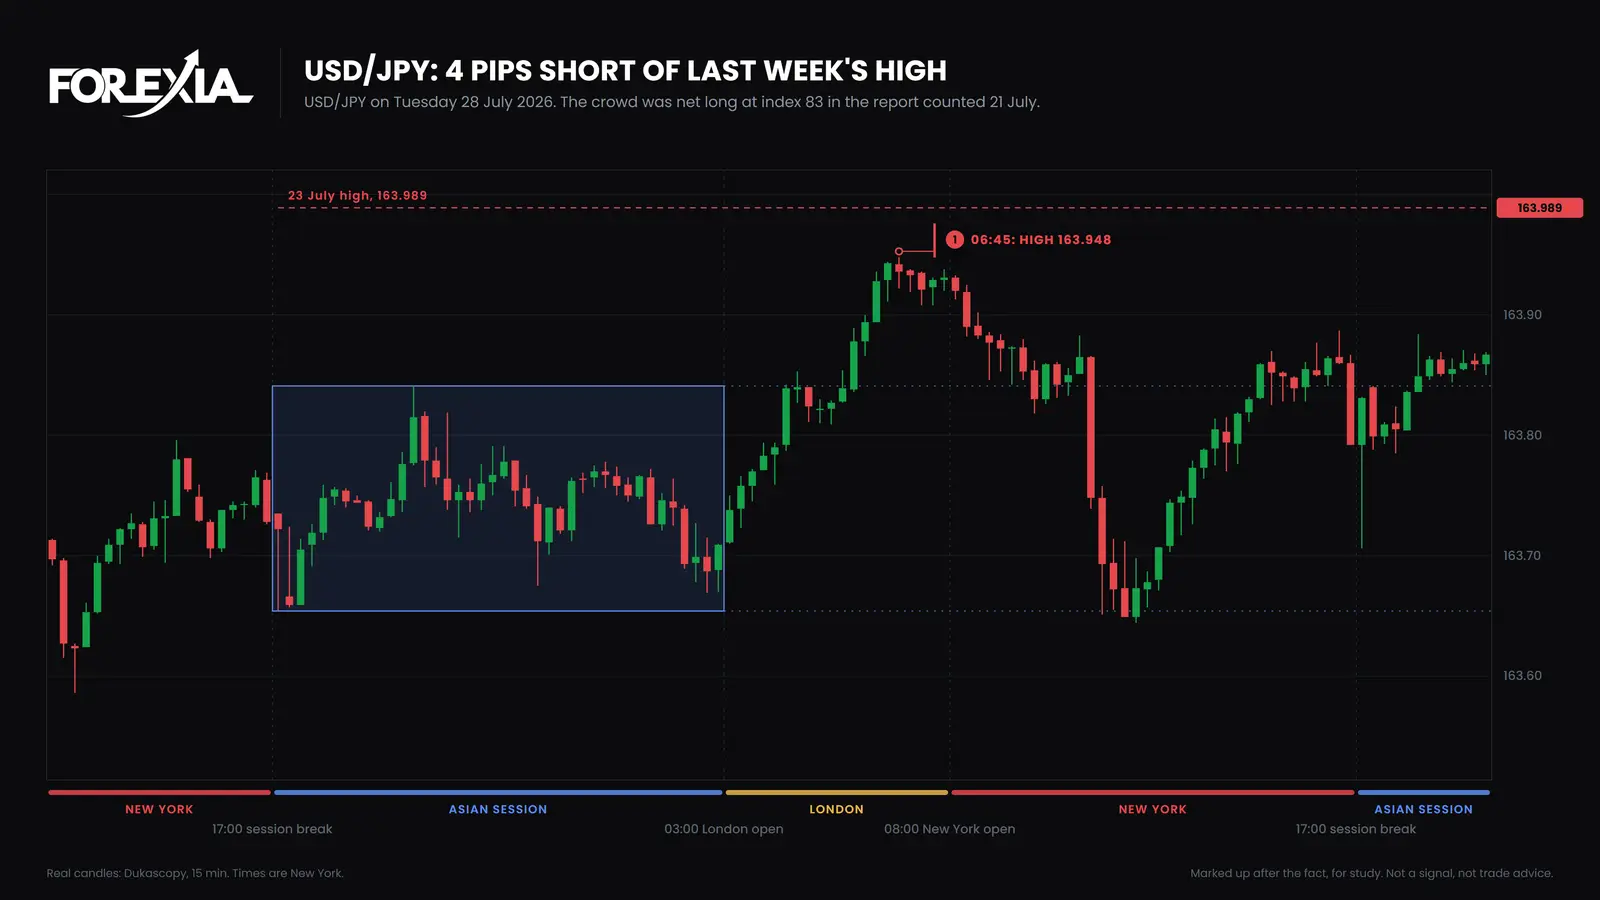
The COT report JPY traders read for the week published on 24 July 2026 showed the large speculators short 259,715 yen futures and long 107,590. That looks like a crowd against the yen's rival, and it is: in the pair's terms they were net long USD/JPY by 152,125 contracts, index 83, crowded long. We read that as the side not to join. Last week's high was 163.989, and on the following Tuesday USD/JPY came within 4 pips of it.
This is one dated report, and not the newest. On 13 October the yen's index was 36, which reads as nothing, so we use the week of 21 July when it was at an end. The guide to the Commitment of Traders report explains the groups and the formula, and what the COT report is in forex is the short version.
How do you read the COT report JPY?
You turn it round first. The contract is Japanese Yen at the Chicago Mercantile Exchange, code 097741, quoted in dollars per yen, so it runs the opposite way to USD/JPY. Short yen futures is long the pair. Every net position, share and index below is already in the pair's terms. The report was counted on Tuesday 21 July and published on Friday 24 July.
Here is that Tuesday, from the CFTC's public figures, with open interest of 423,796 contracts. The first two rows are from the legacy report and the rest from Traders in Financial Futures.
| Group, in the pair's terms | Net position | Share | Index |
|---|---|---|---|
| Large speculators (non-commercial) | +152,125 | +35.9% | 83 |
| Commercials | −154,898 | −36.6% | 17 |
| Dealers | −133,699 | −31.5% | 20 |
| Leveraged funds | +96,185 | +22.7% | 75 |
| Asset managers | +79,906 | +18.9% | 84 |
The first row is the crowd. In the futures it held 107,590 long and 259,715 short, and the table gives the same position the pair's way. Its share ran from 50.7% short to 53.5% long over the 156 weeks, so 35.9% sat near the top of that range. It was the first report at 80 or over after two at 78.
The groups split by what they do. Leveraged funds and asset managers were on the same side as the crowd, both near the top of their own ranges. Commercials and dealers were on the other. Legacy sorts a trader by whether it hedges, and the other report sorts by the kind of business, so those four rows are not one view.
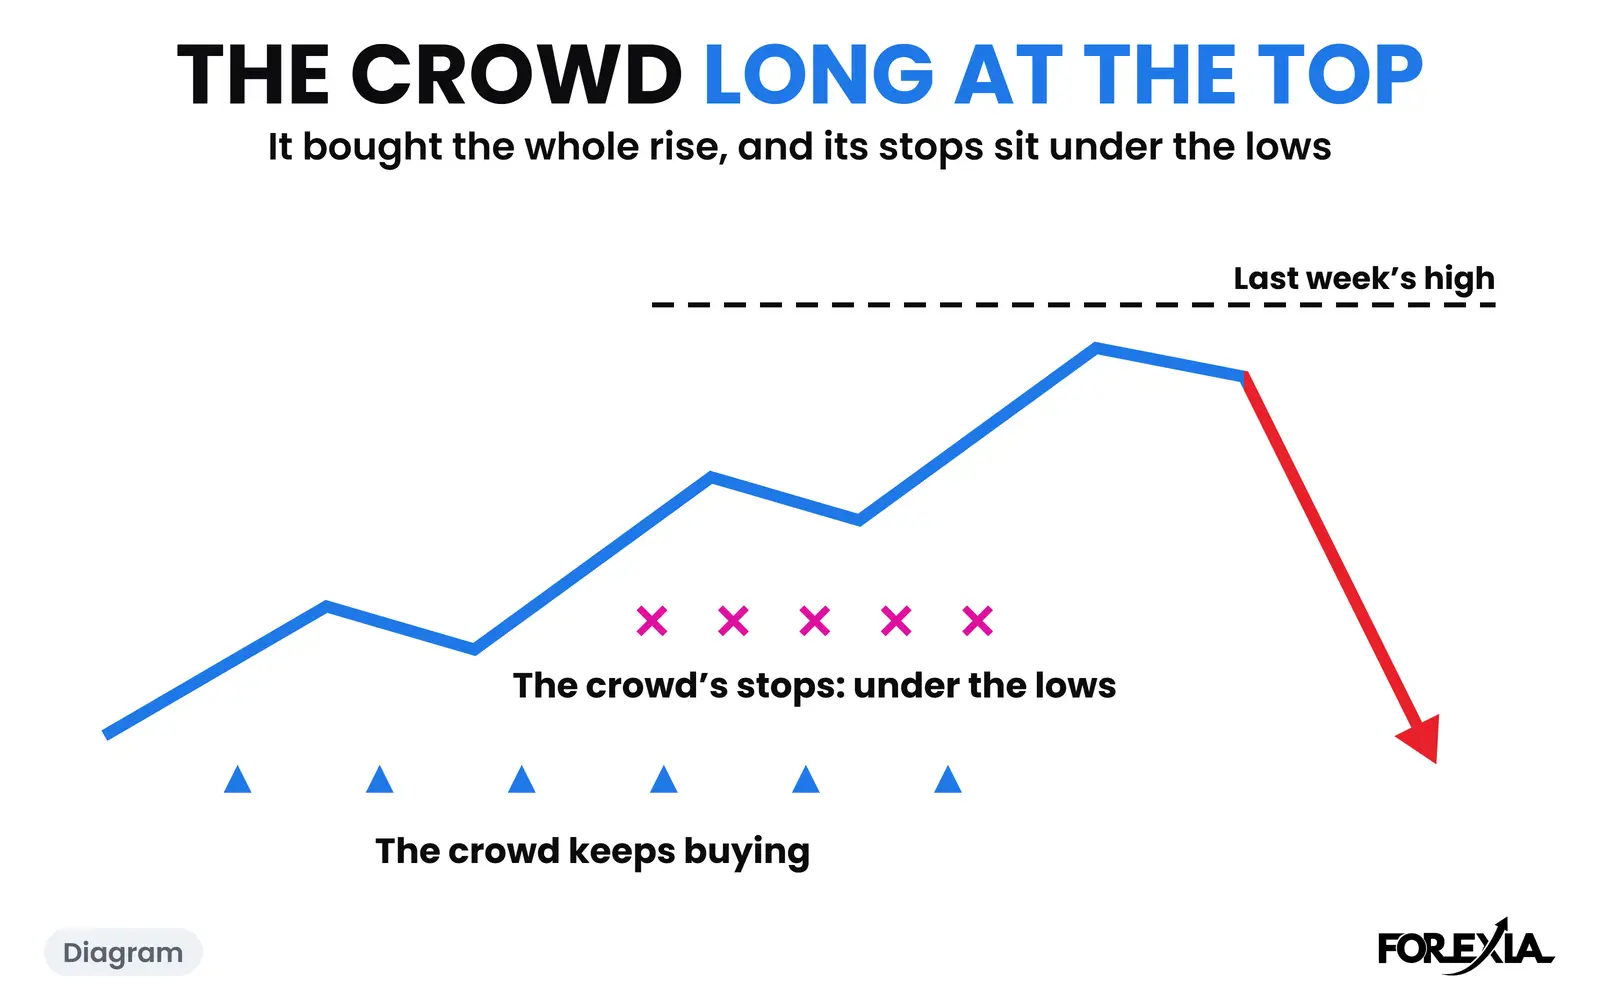
At index 83 on 21 July we read the crowd as the side not to join, which is Fade the Crowd. That ruled out buying with it. It did not make a sell.
Which level mattered on USD/JPY?
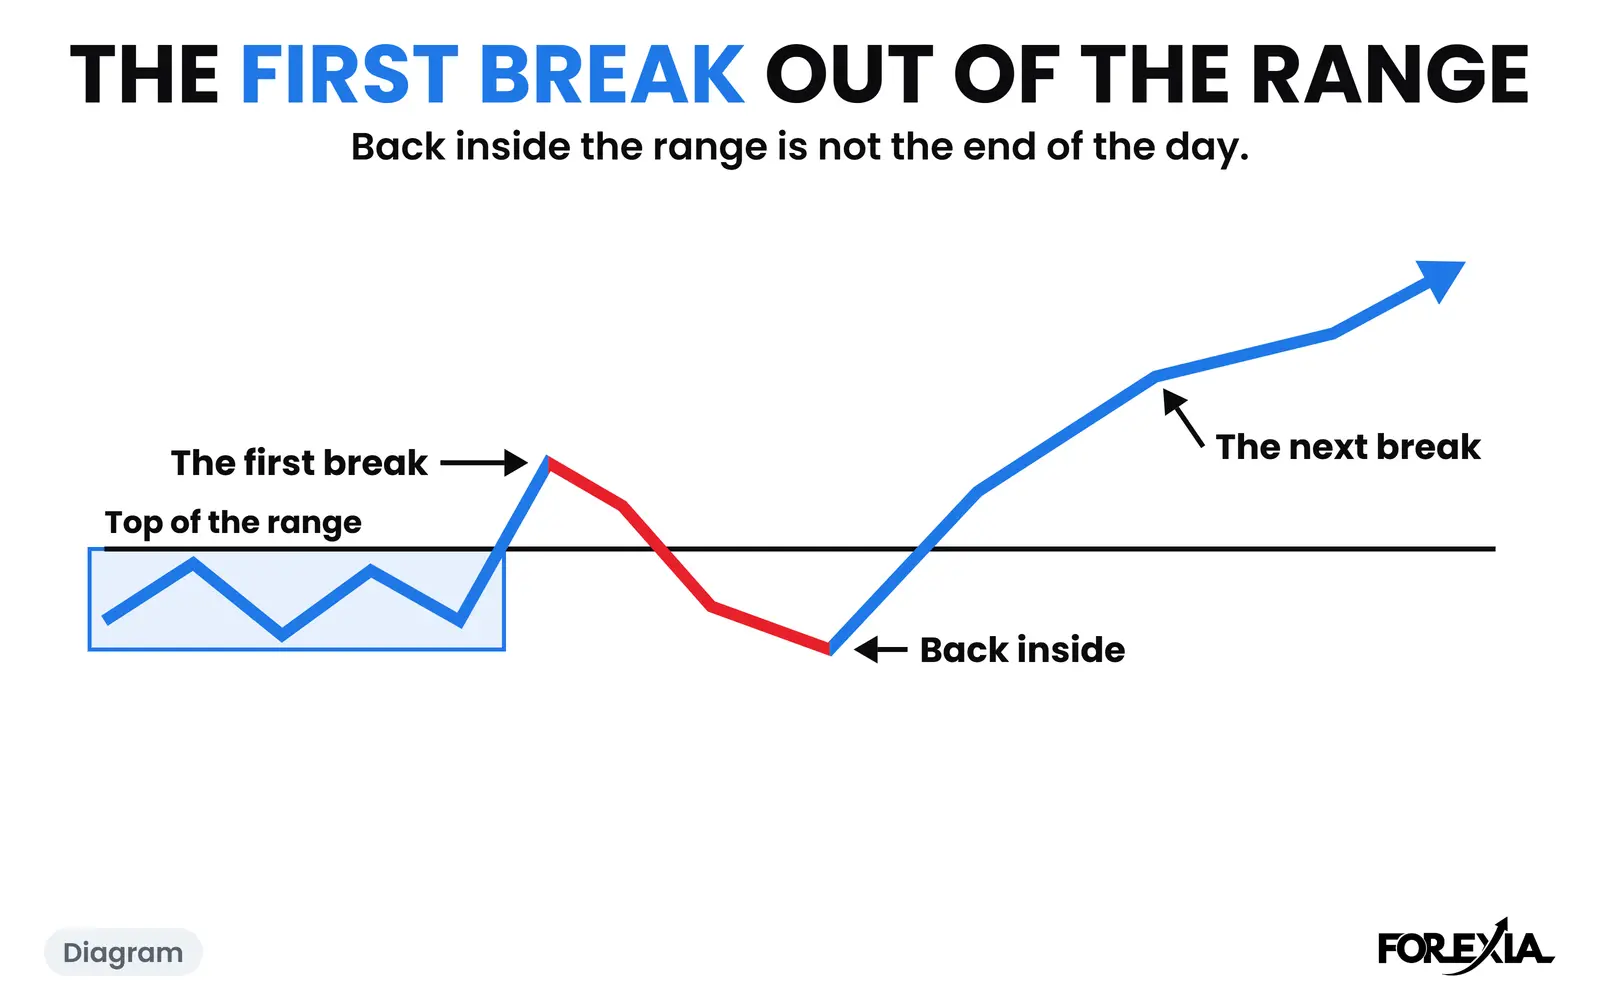
Last week's high, because it was the line the crowd's buying was pressing against, and last week's low, because under it we read the crowd's stops. At Friday's close USD/JPY was at 163.793. The week's high was 163.989, from 10:45 New York on Thursday 23 July. Its low was 162.195, from Monday 20 July. The report holds no stop orders, so all of this is a reading of the structure.
What a member does with those lines stays in the course. Here is only what price did.
What did USD/JPY do after the report?
It stopped just short of the high, and then it fell through the low. On Tuesday 28 July it reached 163.948 at 06:45 New York, 4 pips under 163.989, and went no higher in the days after.
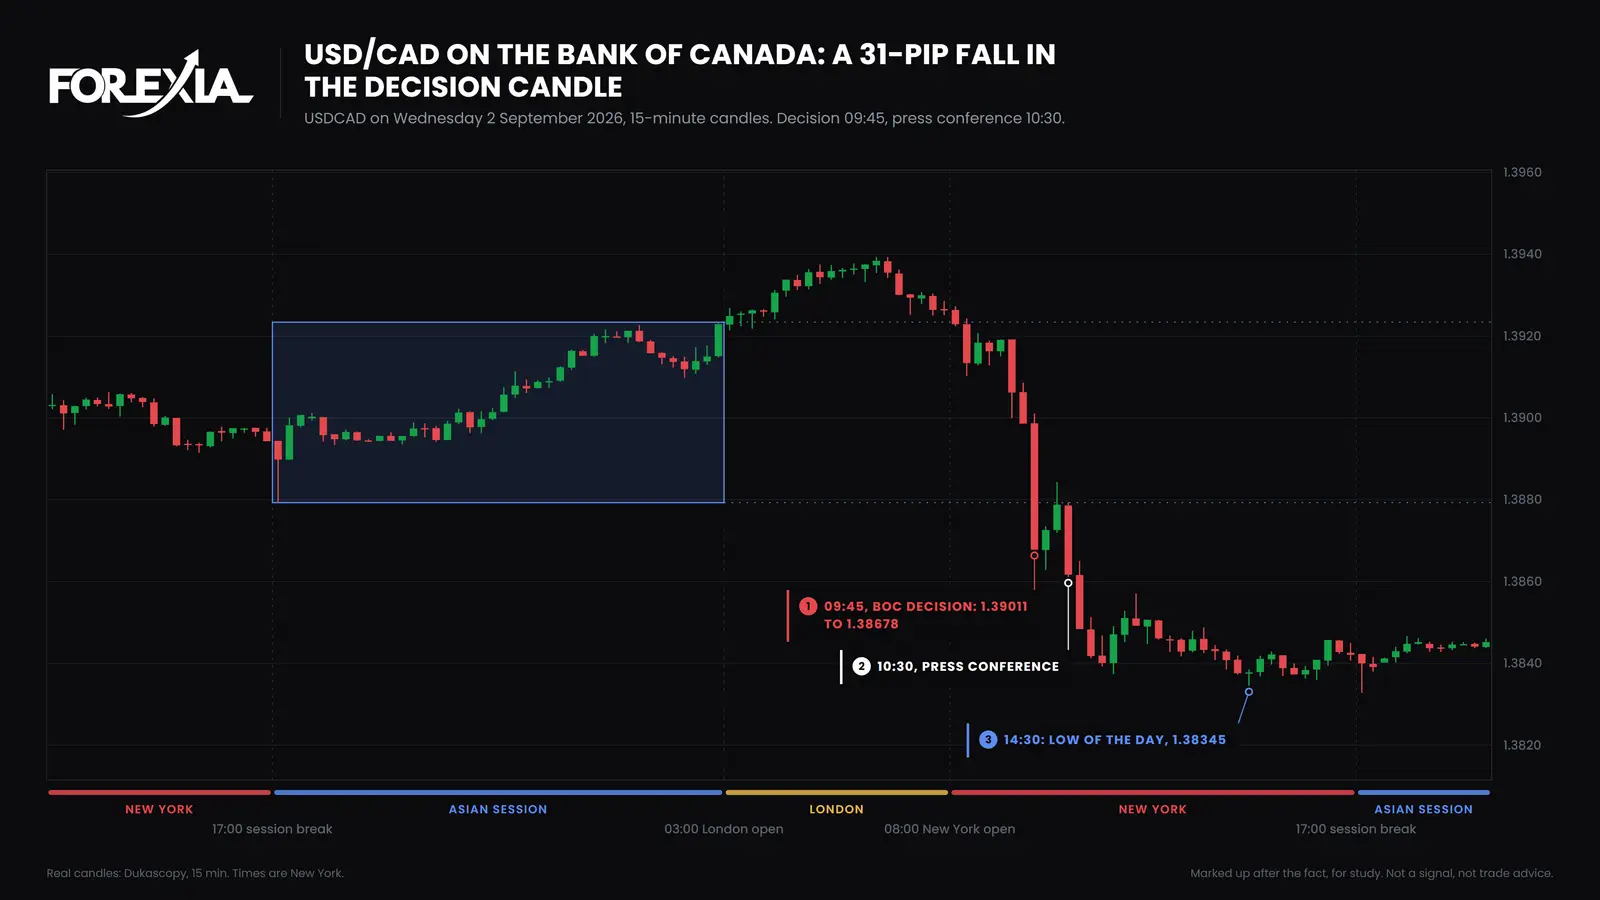
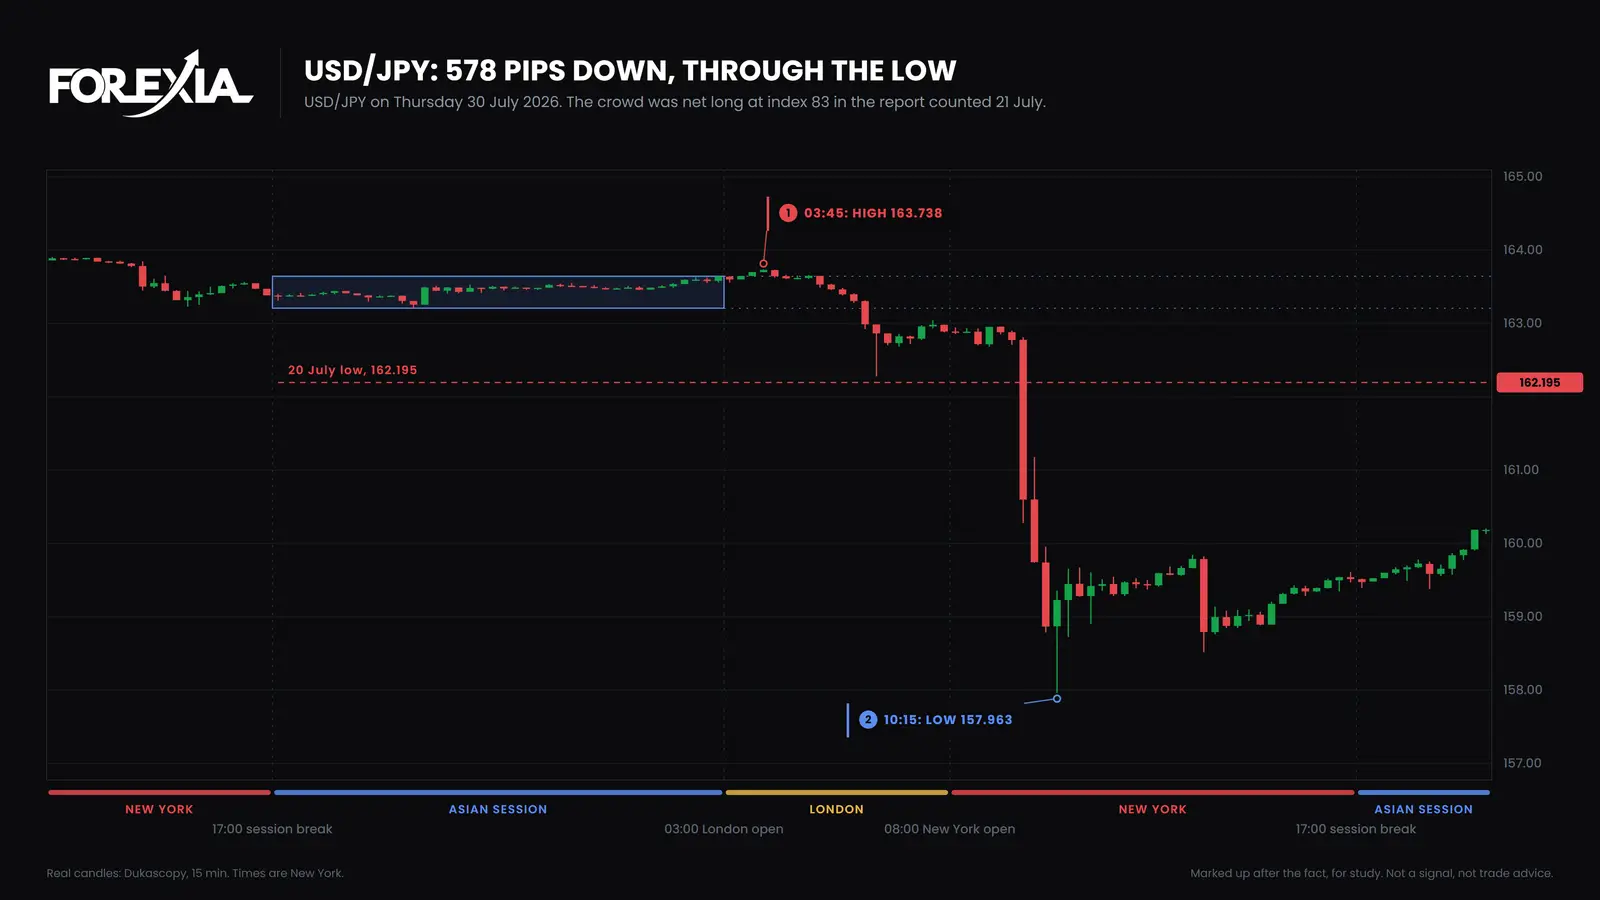
On Thursday 30 July it opened at 163.383 and traded to 163.738 at 03:45. The 09:30 candle was the first under last week's low and reached 160.279. At 10:15 the pair printed 157.963, 578 pips under the high, and the day ended at 159.514. Our calendar lists US GDP and core PCE at 08:30, and Tokyo CPI and the Bank of Japan's decision that evening. A chart cannot show which of those, if any, moved it. We read the fall through 162.195, with a crowded long behind it, as the stop hunt, which most traders call a liquidity sweep.
The next count made the lag plain. It was taken on 28 July, with the pair at 163.792, and showed the crowd at index 85. It was published on Friday 31 July, a day after the fall. The count of 4 August showed net long down to 45,473 contracts, index 59, and by then price had gone to 157.704. The COT report page has the lag worked on the same days.
Read that with care. This is not a report that called a fall: the crowd's index went up for another week, and the fall came in the gap between a count and its release. Most crowded readings are followed by nothing so clear. Run as a mechanical rule, trading against a hunt did not make money in our own test, and many hunts have another leg. In our test of the report, joining a crowded side lost, and fading it is promising and not proven. And this report was built afterwards: those published before 2 October 2026 were built by the same rules, after the fact.
How has the yen's crowd moved through 2026?
It spent the summer near the top of its range, then lost most of its length in one week. Our index reads the crowd against its own 156 weeks, in the pair's terms, and each row is a Tuesday count.
| Report counted | Net position | Share | Index | USD/JPY at Tuesday's close |
|---|---|---|---|---|
| 23 June | +146,104 | +33.9% | 81 | 161.544 |
| 7 July | +123,778 | +31.1% | 78 | 162.090 |
| 14 July | +122,663 | +30.9% | 78 | 162.234 |
| 21 July | +152,125 | +35.9% | 83 | 163.161 |
| 28 July | +163,412 | +37.8% | 85 | 163.792 |
| 4 August | +45,473 | +10.8% | 59 | 157.704 |
| 11 August | +42,085 | +10.7% | 59 | 159.272 |
| 18 August | +52,893 | +13.9% | 62 | 159.603 |
In the 156 reports to 29 September 2026 this crowd, turned round, was crowded short 35 times and crowded long 31 times, net long the pair in 87, and its longest run on one side was 24 reports, short. So it does change sides, and a reading at 83 is not rare. The euro's report and the pound's are the same read on other majors.
What did each seat read in the yen's report?
The same table reads three ways, from the three seats.
- Retail sees funds short yen futures and a falling yen, and does one of two things: sells USD/JPY believing it has joined them, or buys believing it has not. The first has it backwards.
- The market maker, as we read it, sees a crowd that must sell to get out, with stops under the lows, and commercials and dealers already short the pair.
- The observer sees which side is ruled out, and the report's age. It does not see when.
What do traders get wrong about the yen's COT report?
Three errors recur on this market.
- Not turning it round. The futures showed funds short. The pair's crowd was long.
- Reading 85 as a sell. The index rose from 83 to 85 in the week the pair began to fall.
- Treating the report as current. The fall of 30 July came between the count of the 28th and its release.
Course 1 of ForexiaPRO, Reading the Map, teaches this read step by step in lesson 1.3.4, Reading This Week's Report.
Frequently asked questions
What contract is the yen's COT report?
Japanese Yen on the Chicago Mercantile Exchange, CFTC code 097741. It is quoted as dollars per yen, the opposite way round to USD/JPY, so every position has to be turned round before it is read as the pair. It appears in both the legacy and Traders in Financial Futures reports.
Why do funds look short when USD/JPY is crowded long?
Because short yen futures is long USD/JPY. On 21 July 2026 the large speculators held 107,590 yen contracts long and 259,715 short, a net short of 152,125 in the futures. In the pair's terms that is net long 152,125, 35.9% of open interest, at an index of 83.
What does an index of 83 on USD/JPY mean?
That the large speculators' net position, as a share of open interest and in the pair's terms, is near the most long it has been in the last 156 weeks. We call 80 or over crowded long. It describes where they stand, not when price turns.
How often is the yen's crowd crowded?
In the 156 reports to 29 September 2026, with the futures turned round, the crowd was crowded short in 35 weeks and crowded long in 31, and the longest run on one side was 24 weeks, short. They were net long USD/JPY in 87 of the 156. It really does change sides.