COT Report GBP: The Crowd at Index 0, and a Report That Came Late
Dylan Forexia7 min read
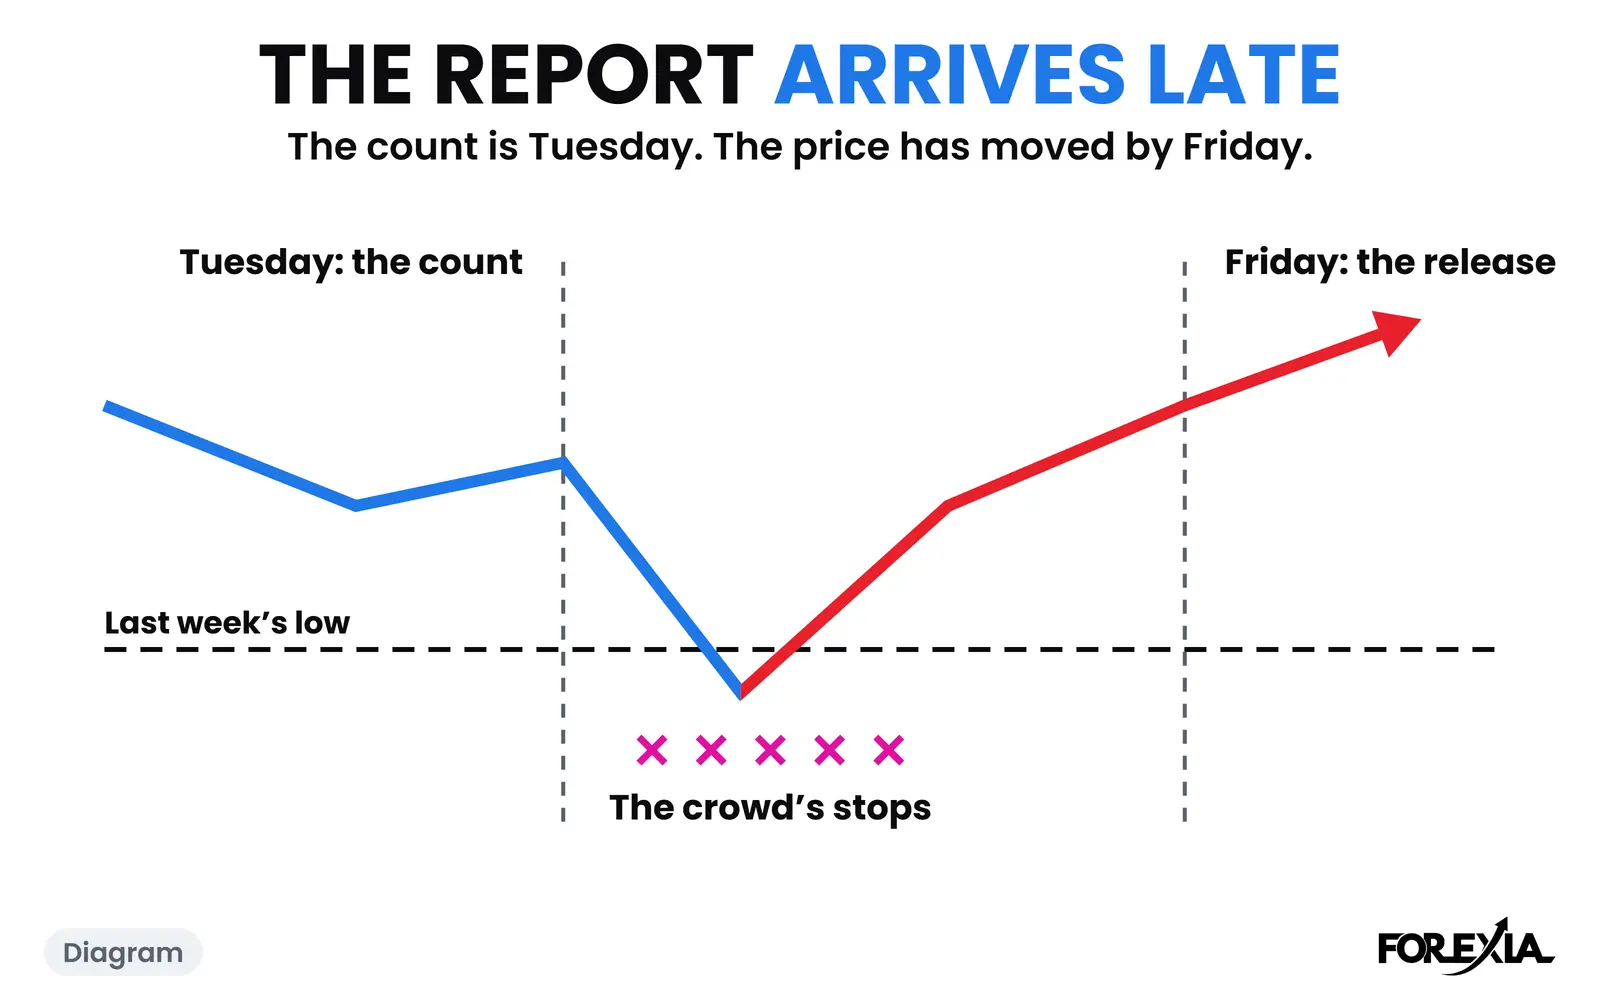
The COT report GBP traders read for the week published on 16 October 2026 had large speculators net short 106,964 contracts, index 0: the most short in three years. We read that as the side not to join. The nearest line on the crowd's side was the low of 8 October, at 1.31843. But the report was three days old when it came out, and the pound had already turned.
This is one dated report. The guide to the Commitment of Traders report explains the groups and the formula, and what the COT report is in forex is the short version.
How did the COT report GBP read that week?
It read as far to one side as that crowd had been in three years. The contract is British Pound at the Chicago Mercantile Exchange, code 096742, and it runs the same way round as the pair. The report was counted on Tuesday 13 October and published on Friday 16 October.
Here are the groups on that Tuesday, with open interest of 268,532 contracts. The first two rows are from the legacy report and the rest from Traders in Financial Futures, in the CFTC's public figures.
| Group | Net position | Share | Index |
|---|---|---|---|
| Large speculators (non-commercial) | −106,964 | −39.8% | 0 |
| Commercials | +121,444 | +45.2% | 100 |
| Dealers | +150,796 | +56.2% | 100 |
| Leveraged funds | +10,313 | +3.8% | 27 |
| Asset managers | −145,735 | −54.3% | 1 |
The first row is the crowd, with 44,185 contracts long and 151,149 short. It got there by selling: 23,103 new short contracts in four weeks, while 25,146 long contracts went. The pound fell 1.7% over those four weeks. It was the sixth report in a row at 20 or under, and the third at 0.
Read the table down the index column, not across. Commercials and dealers, who stood on the other side, were at 100 on their own ranges. Asset managers, who had the largest short of any group, were at 1. Those are not two crowds that happen to agree. Legacy sorts a trader by whether it hedges, and the other report sorts by the kind of business, so on one contract and one day the two sides are named differently.
At index 0 on 13 October we read the crowd as the side not to join, which is Fade the Crowd. So that report ruled out selling with it. It did not make a buy.
Which level mattered on GBP/USD?
The low of 8 October, because it was the nearest line on the side the crowd was selling. We read each short as a stop above the highs, and under that low we read the stops of anyone who bought, and the orders of anyone waiting to sell a break.
At Tuesday's close the pound was at 1.32544, and last week's low was 1.31843, from Thursday 8 October. The report holds no stop orders, so all of this is a reading of the structure.
What a member does with that level stays in the course. Here is only what price did with it.
What did GBP/USD do after the count?
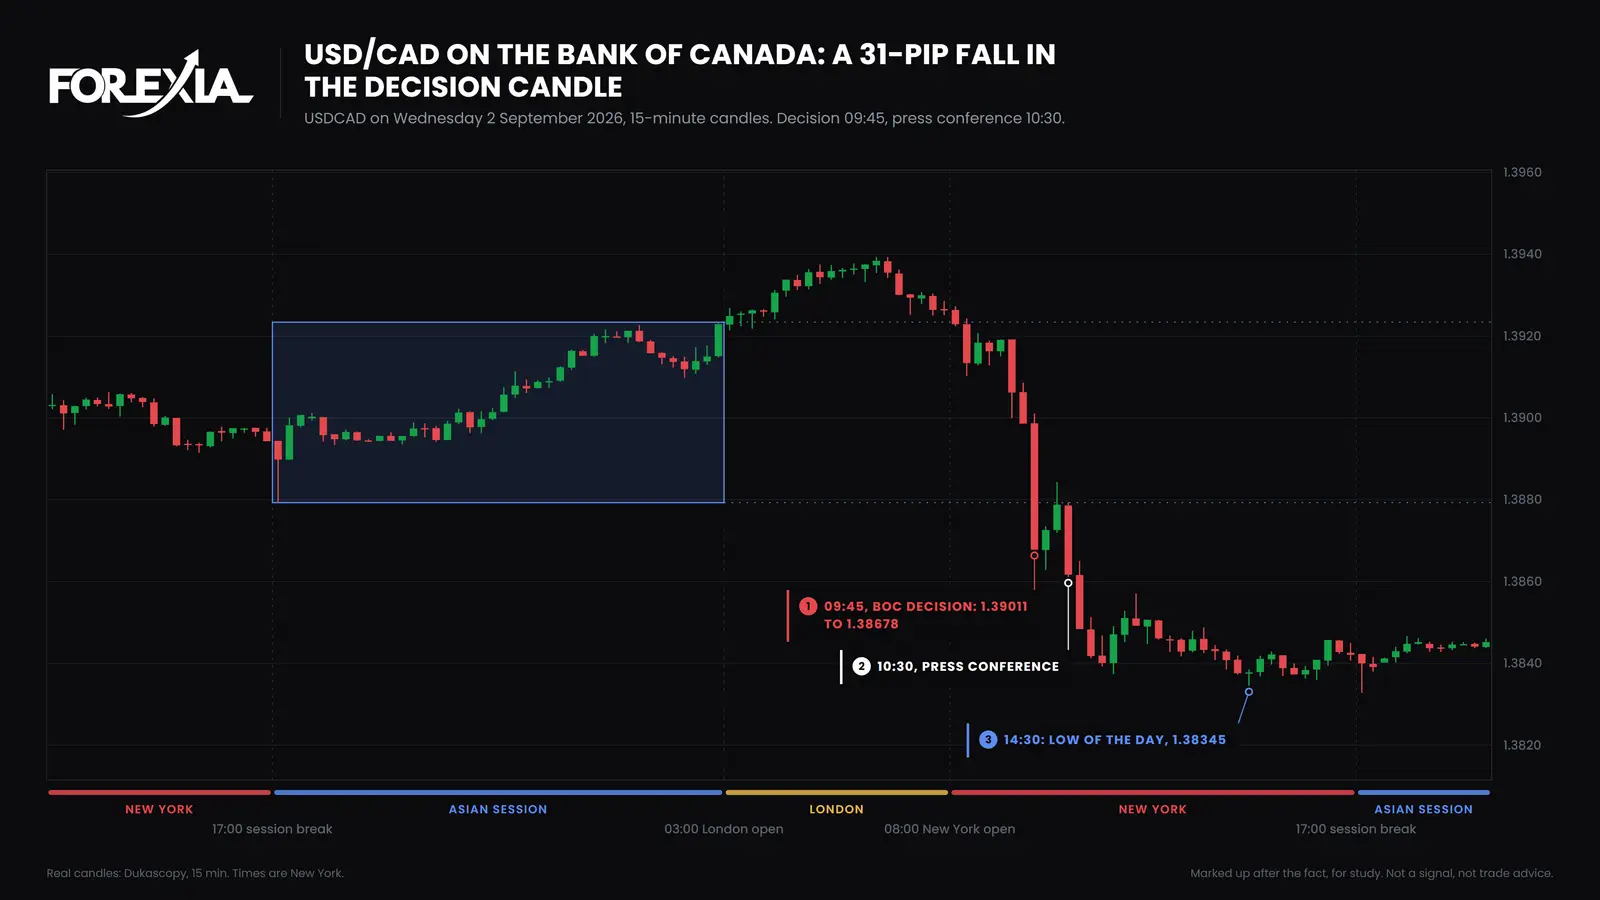
It went under the low the next morning, and had come back before the report was out. On Wednesday 14 October US inflation data came at 08:30 and the pound fell to 1.31366 at 11:00, 48 pips under the low of 8 October. It closed that day at 1.31919. That day is the one drawn on the COT report page, as a stop hunt, which most traders call a liquidity sweep.
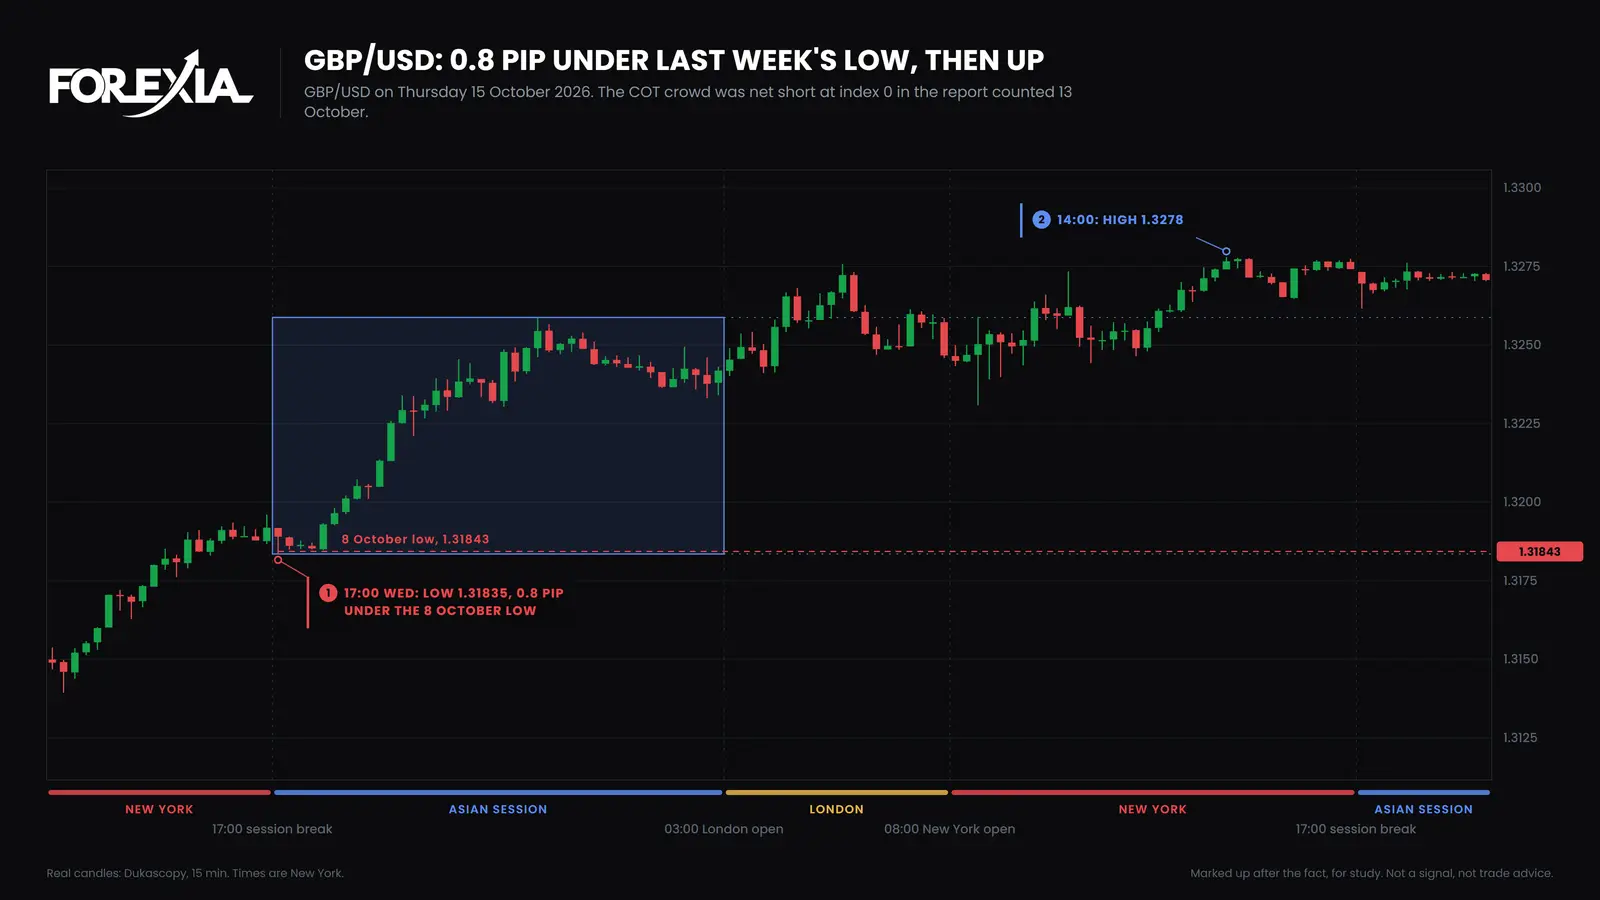
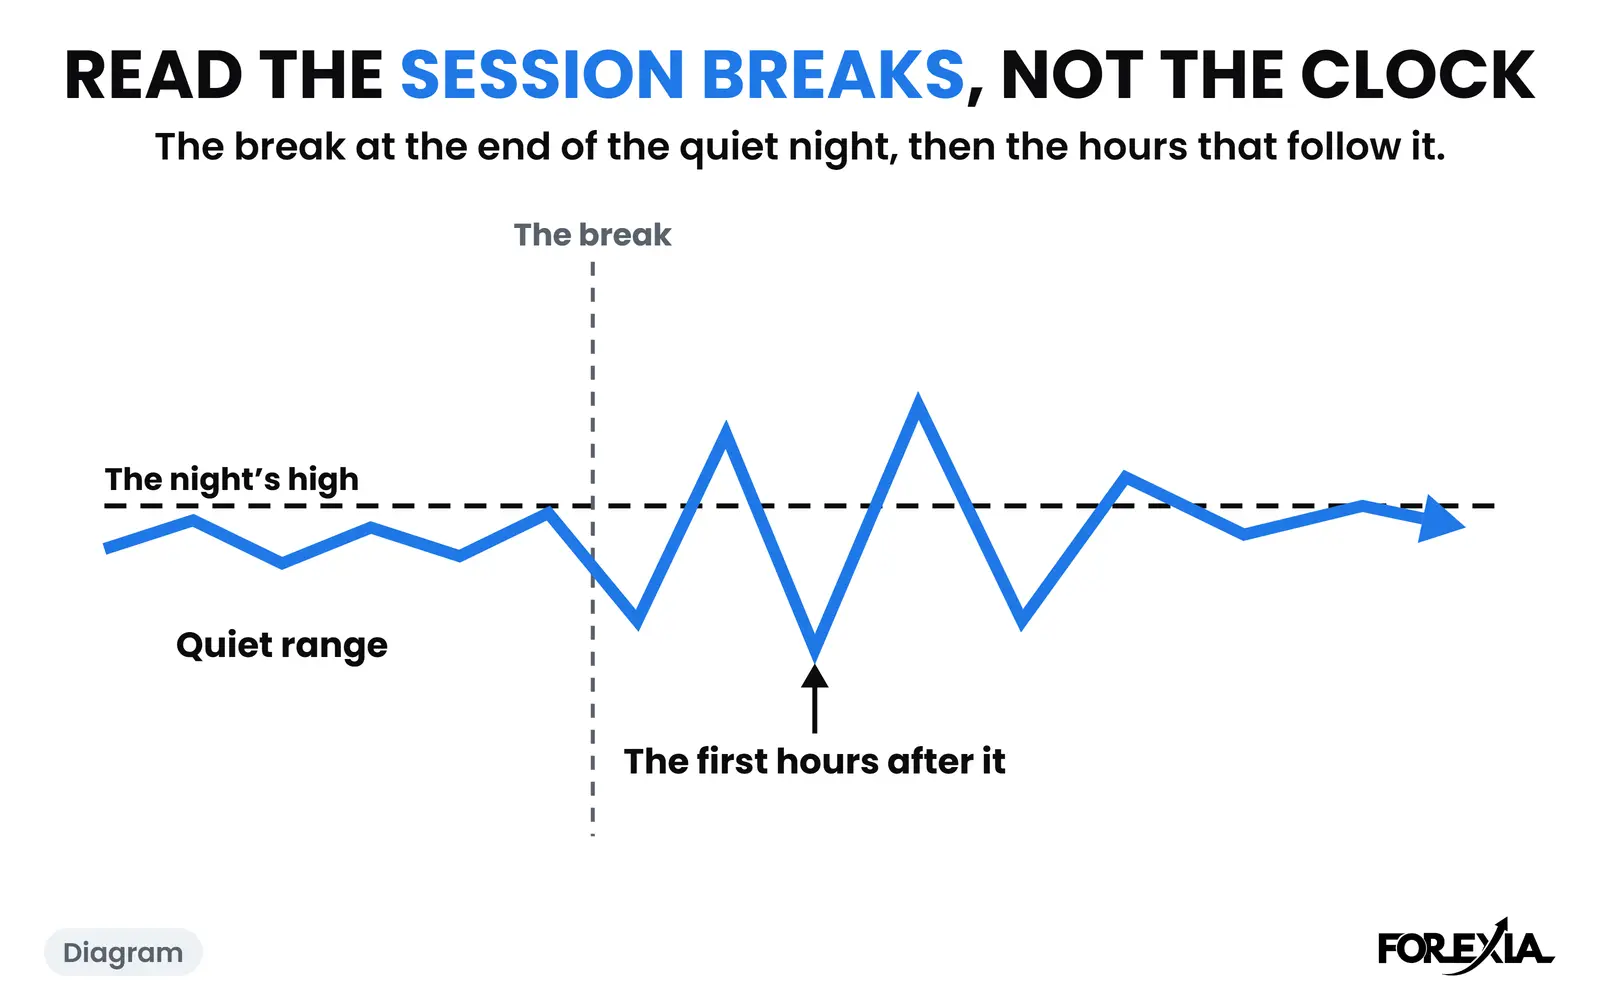
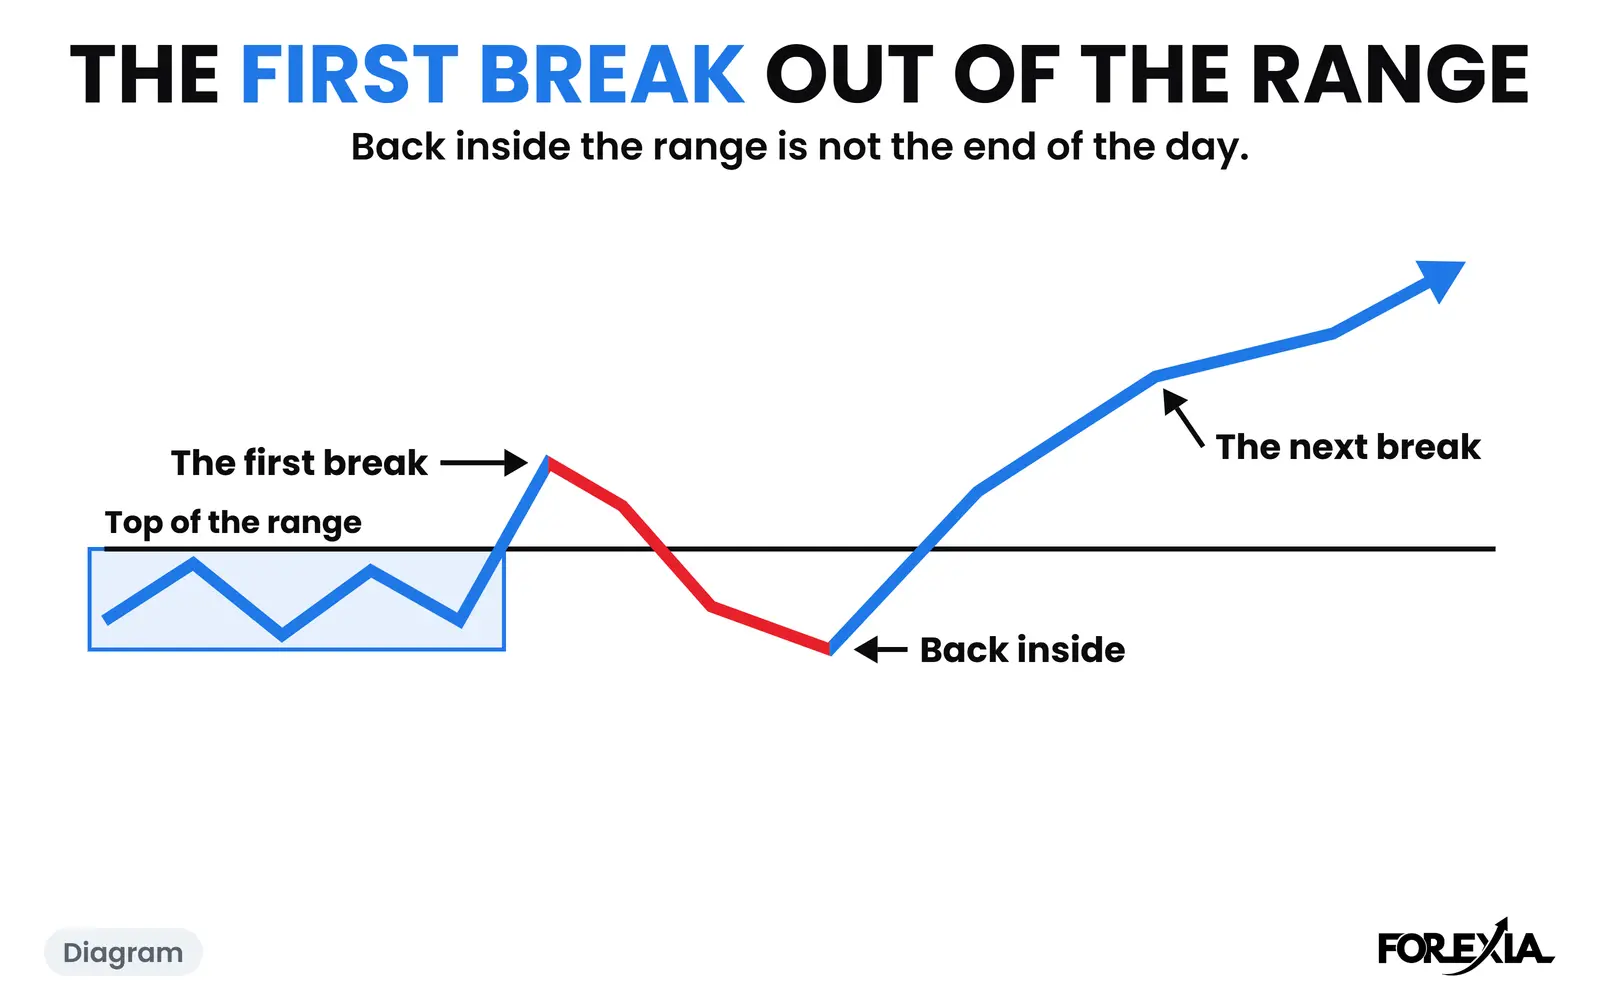
The next session began at 17:00 New York on Wednesday, and its first candle traded to 1.31835, under the old low by less than a pip. From there it rose through the night and the day to 1.3278, and closed at 1.32742. We read the move back as the Close Back. All of it happened before the report was published at 15:30 on Friday 16 October, when the pound stood near 1.3328.
So a reader who waited for the release got the crowd at index 0 with the hunt already over. That is the lag, a limit of the report and not a mistake in it. The pound did not return to the low in the two weeks after: its lowest trade between the release and 30 October was 1.32723, on 28 October.
On Tuesday 20 October it went on to 1.34092 at 10:30 New York, on a day that carried UK jobs figures at 02:00. The count that day had the crowd at index 9, net short 80,420: it had bought back 26,544 contracts. The high of that fortnight, 1.34189, came on Thursday 22 October.
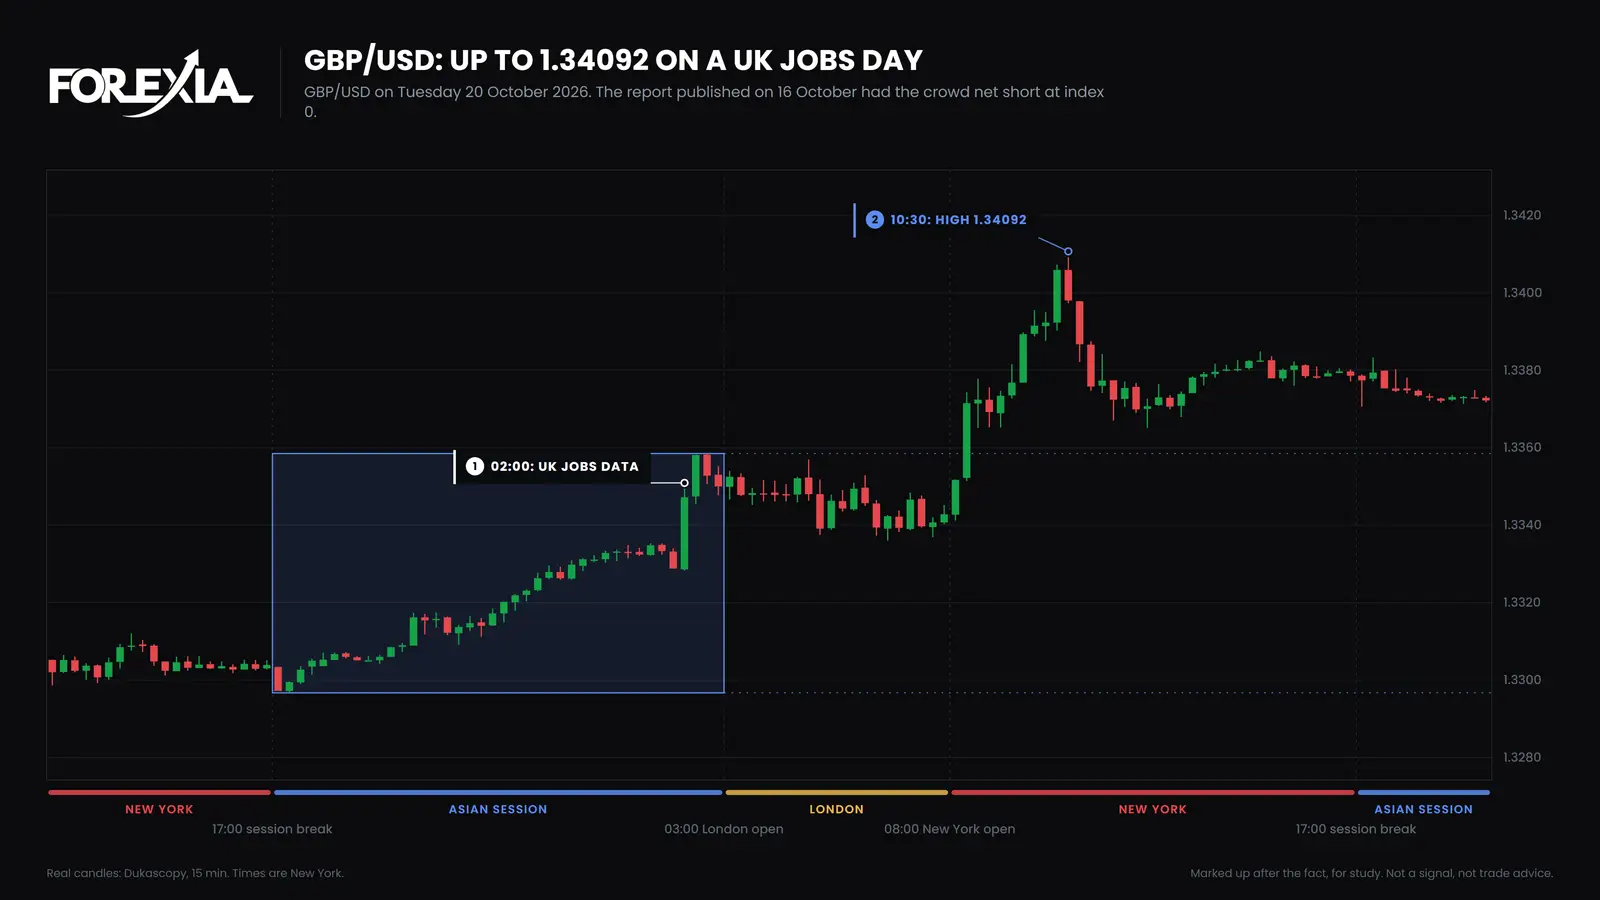
Read that with care. This is not a report that called a turn: the turn was already a day old when it came out. It said which side not to join. Run as a mechanical rule, trading against a hunt did not make money in our own test, and many hunts have another leg. In our test of the report, joining a crowded side lost, and fading it is promising and not proven.
How has the pound's crowd moved through 2026?
It stayed near the short end for months, and went to the far end in autumn. Our index reads the crowd against its own 156 weeks, and each row here is a Tuesday count.
| Report counted | Net position | Share | Index | Pound at Tuesday's close |
|---|---|---|---|---|
| 21 July | −55,561 | −21.2% | 17 | 1.33749 |
| 18 August | −54,573 | −19.1% | 19 | 1.35322 |
| 15 September | −58,715 | −18.7% | 20 | 1.34769 |
| 22 September | −82,568 | −33.7% | 2 | 1.33428 |
| 6 October | −97,611 | −36.7% | 0 | 1.32738 |
| 13 October | −106,964 | −39.8% | 0 | 1.32544 |
| 20 October | −80,420 | −31.7% | 9 | 1.33786 |
| 27 October | −79,414 | −31.3% | 10 | 1.33055 |
Those from before 2 October were built afterwards, by the same rules. In the 156 reports to 29 September 2026 this crowd was crowded short 50 times and crowded long 29 times, net long in 77, and its longest run on one side was 27 reports, short, from 17 February 2026. It changes sides, but it can stay at an end for most of a year, so a reading at one end says little about the date. The euro's report from the same week sat at the same end and the price behaved differently.
What did each seat read in the pound's report?
The same table reads three ways, from the three seats.
- Retail sees funds short and a weak pound, and sells. On Wednesday 14 October that seller sold into the low and was back above it by the close.
- The market maker, as we read it, sees a crowd that must buy back, with stops above the highs, and dealers already long 150,796 contracts.
- The observer sees which side is ruled out. It does not see when, and on the Friday it would have seen a turn that was already two days old.
What do traders get wrong about the pound's COT report?
Three errors recur on this market.
- Thinking index 0 means the pound must rise. It was 0 on 29 September, 6 October and 13 October, and the pound fell across that run before it rose.
- Reading the release as news. The Friday report describes Tuesday. By then the pound had hunted a low and closed back.
- Treating dealers' 100 and asset managers' 1 as one view. They are different businesses on one contract, and the index compares each with itself.
For the same read on the other majors, see the yen's report and the Australian dollar's.
Course 1 of ForexiaPRO, Reading the Map, teaches this read step by step in lesson 1.3.4, Reading This Week's Report.
Frequently asked questions
What contract is the pound's COT report?
British Pound on the Chicago Mercantile Exchange, CFTC code 096742. It is quoted as dollars per pound, the same way round as GBP/USD, so it needs no turning round. The yen, franc and Canadian dollar futures do. It appears in both the legacy and Traders in Financial Futures reports.
What does an index of 0 on GBP/USD mean?
That the large speculators' net position, as a share of open interest, is the most short it has been in the last 156 weeks. On 13 October 2026 it was 39.8% short. It describes where they stand. It says nothing about when, or whether, the pound turns.
Why do dealers and asset managers disagree on the pound?
They are different groups with different jobs. On 13 October 2026 Traders in Financial Futures had dealers net long 150,796 contracts and asset managers net short 145,735, on one contract and one day. Dealers stood at an index of 100 and asset managers at 1, each against its own range.
How often is the pound's crowd crowded?
In the 156 reports to 29 September 2026 the pound's large speculators were crowded short in 50 weeks and crowded long in 29, and the longest run on one side was 27 weeks, short. They were net long in 77 of the 156. This crowd spends long stretches at the short end.