Is the COT Report Lagging? Tuesday Data on a Friday, Checked on Real Weeks
Dylan Forexia8 min read
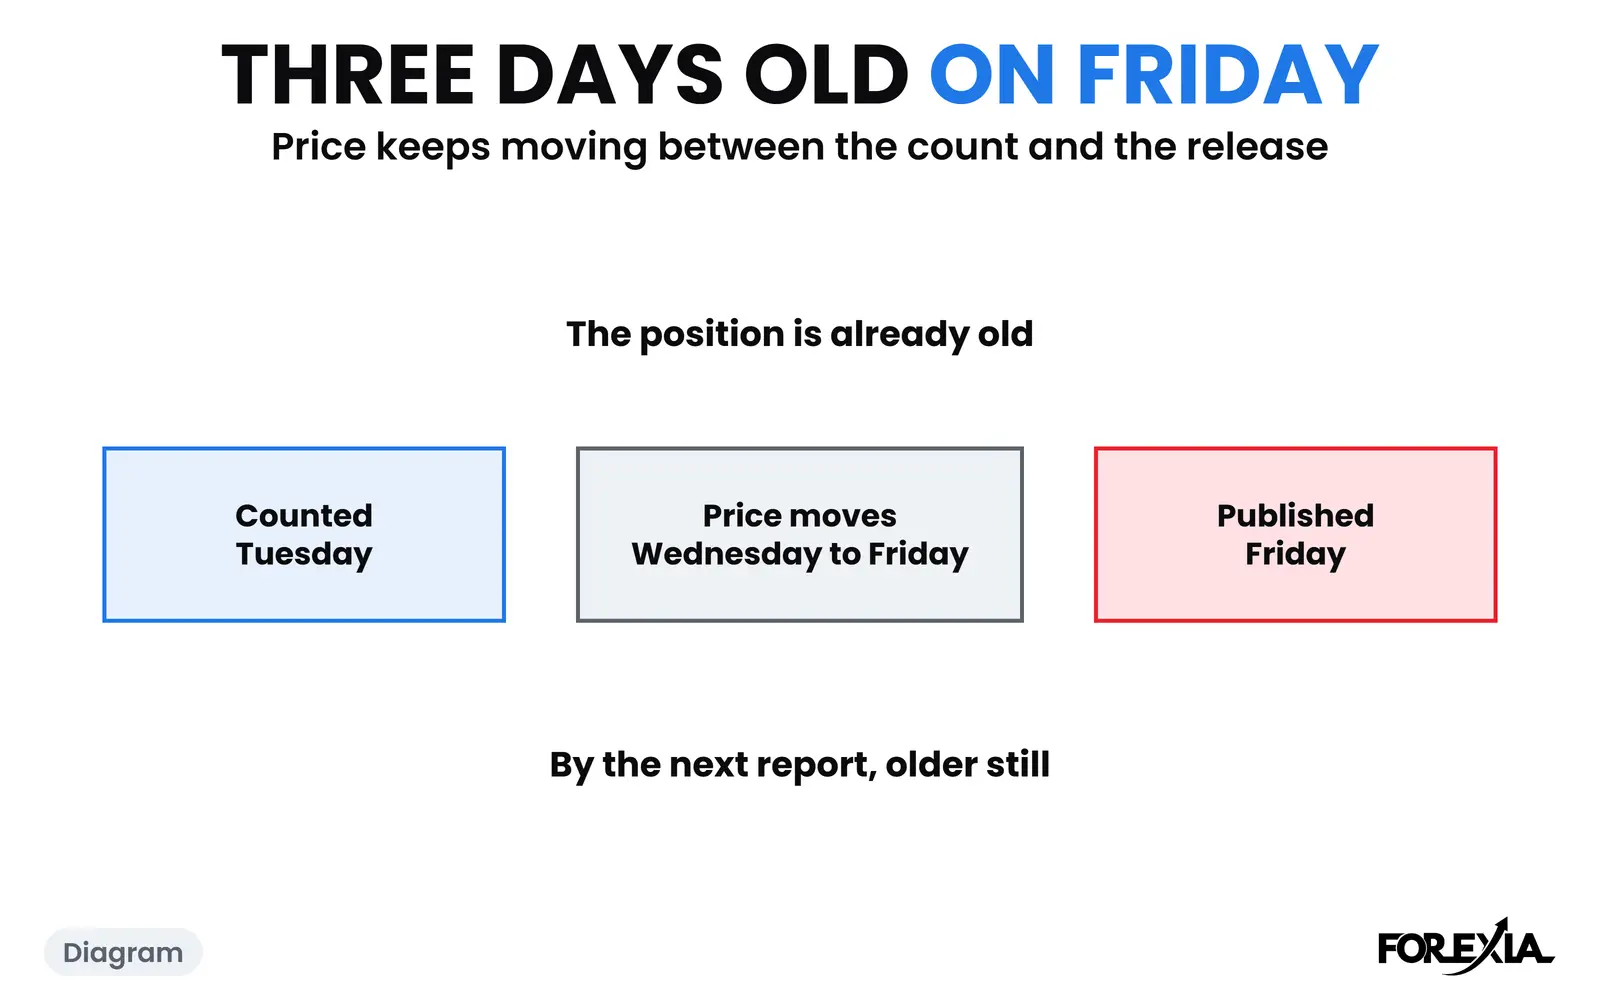
Is the COT report lagging? Yes. The CFTC counts positions on Tuesday and publishes them on Friday at 15:30 New York time, so they are three days old when you read them, and ten days old by the next report. Whether that matters depends on what you use it for. On 1,240 weekly changes in real data, the position moved little from one report to the next, but price can move a long way between the count and the release.
The report counts futures, not spot forex, so it is only a sample of the wider market. What the COT report is in forex covers that, and the guide to the Commitment of Traders report is the full version. Here we ask one thing: how old is the data, and what does the age cost?
Is the COT report lagging? How old it is when you read it
Three days at the Friday release, six when a holiday pushes it to a Monday, and ten by the next report. The CFTC counts the positions on Tuesday, because that is the day the firms that carry the accounts report them, and it publishes after it has checked them. Nothing in between is in the figures.
The release is Friday at 15:30 New York time, and the CFTC calls its schedule tentative. In 2026 six reports are listed as delayed, all to a Monday: 5 January, 22 June, 6 July, 16 November, 30 November and 28 December. The report released on Monday 16 November counts positions as of Tuesday 10 November, which makes it six days old on the day. The release date page has the full 2026 list.
So there are two lags. The first is the gap between the count and the release. The second is that a report keeps being the newest one for a week, so on the next Thursday you are still reading a position counted nine days before.
How far does the position move in a week?
Usually only a few points of the index. We took the large speculators on the seven majors and gold, turned round where the pair needs it, and worked the 0 to 100 index against each market's own 156 weeks, as on our other COT pages. There are 156 reports on each of eight markets, from 10 October 2023 to 29 September 2026, so 1,240 week-to-week changes.
| One week's change in the index | Points |
|---|---|
| Median | 4 |
| Three weeks in four, or less | 8 |
| Nine weeks in ten, or less | 12 |
| Largest | 58 |
Over two weeks the median was 6 points, and nine in ten were 20 or less. The crowded label, an index of 20 or under or 80 or over, held more often than not:
- A week later: of 567 readings that were crowded, 488 were crowded on the same side the week after.
- Two weeks later: of 564, 432 were still crowded on the same side.
- A change of label between one report and the next happened in 157 of the 1,240 comparisons.
These are counts of how the position moved, and not of how price did. They say that a crowd's position is slow. They do not say what price does next. Because the index is read once a week, we cannot say how far the position moved between the Tuesday count and the Friday release. The weekly figures are the nearest we can get, and three days is under half of a week.
When did price move before the report arrived? USD/JPY on 30 July 2026
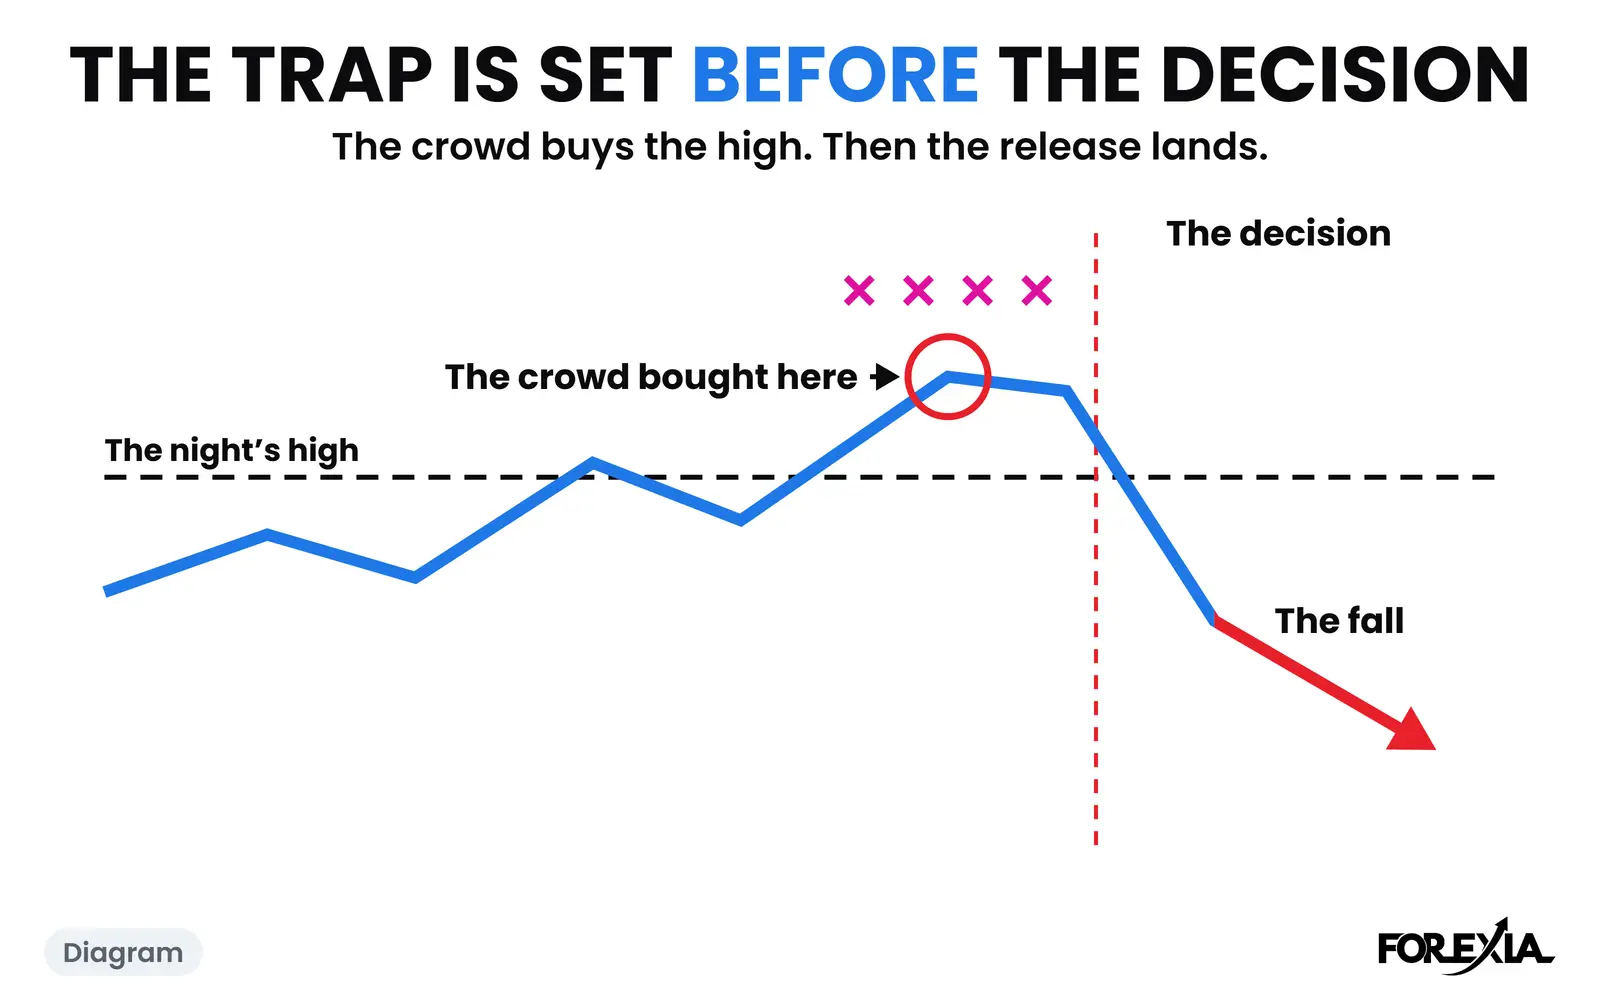
The report counted on Tuesday 28 July 2026 had the large speculators crowded long USD/JPY at an index of 85, and the pair closed that Tuesday at 163.792. On Thursday 30 July it opened at 163.383 and traded to 163.738 at 03:45 New York. The 10:15 candle printed 157.963, 578 pips under that high, and the day closed at 159.514. Our calendar lists US GDP and core PCE at 08:30, and Tokyo CPI and the Bank of Japan's decision that evening, and a chart cannot show which of those, if any, moved it.
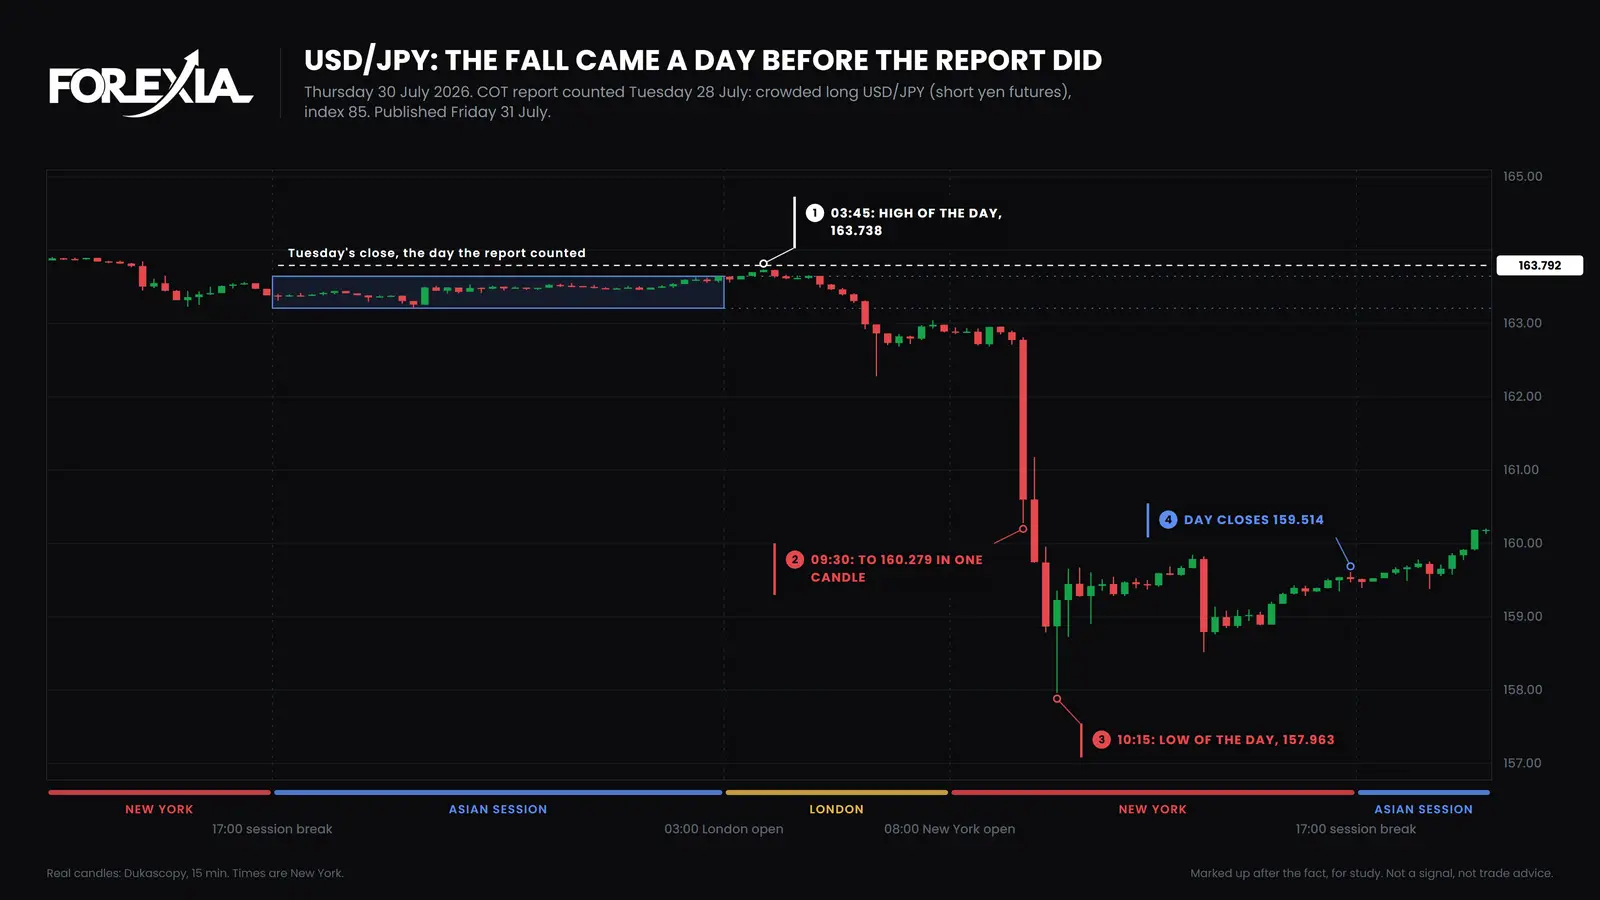
The report came out on Friday 31 July at 15:30, with USD/JPY near 159.04, about 475 pips under Tuesday's close. It said crowded long, index 85, and that was true of Tuesday. The next count, on 4 August, had the net long down to 45,473 contracts, an index of 59, and by then the pair was at 157.704. Readers learned of the change eight days after the fall.
This is one day, chosen afterwards. The yen's crowd was also long for weeks while the pair rose, so a crowded reading did not say when. The index rose from 83 to 85 in the very week the pair began to fall, and the fall came in the gap between a count and its release.
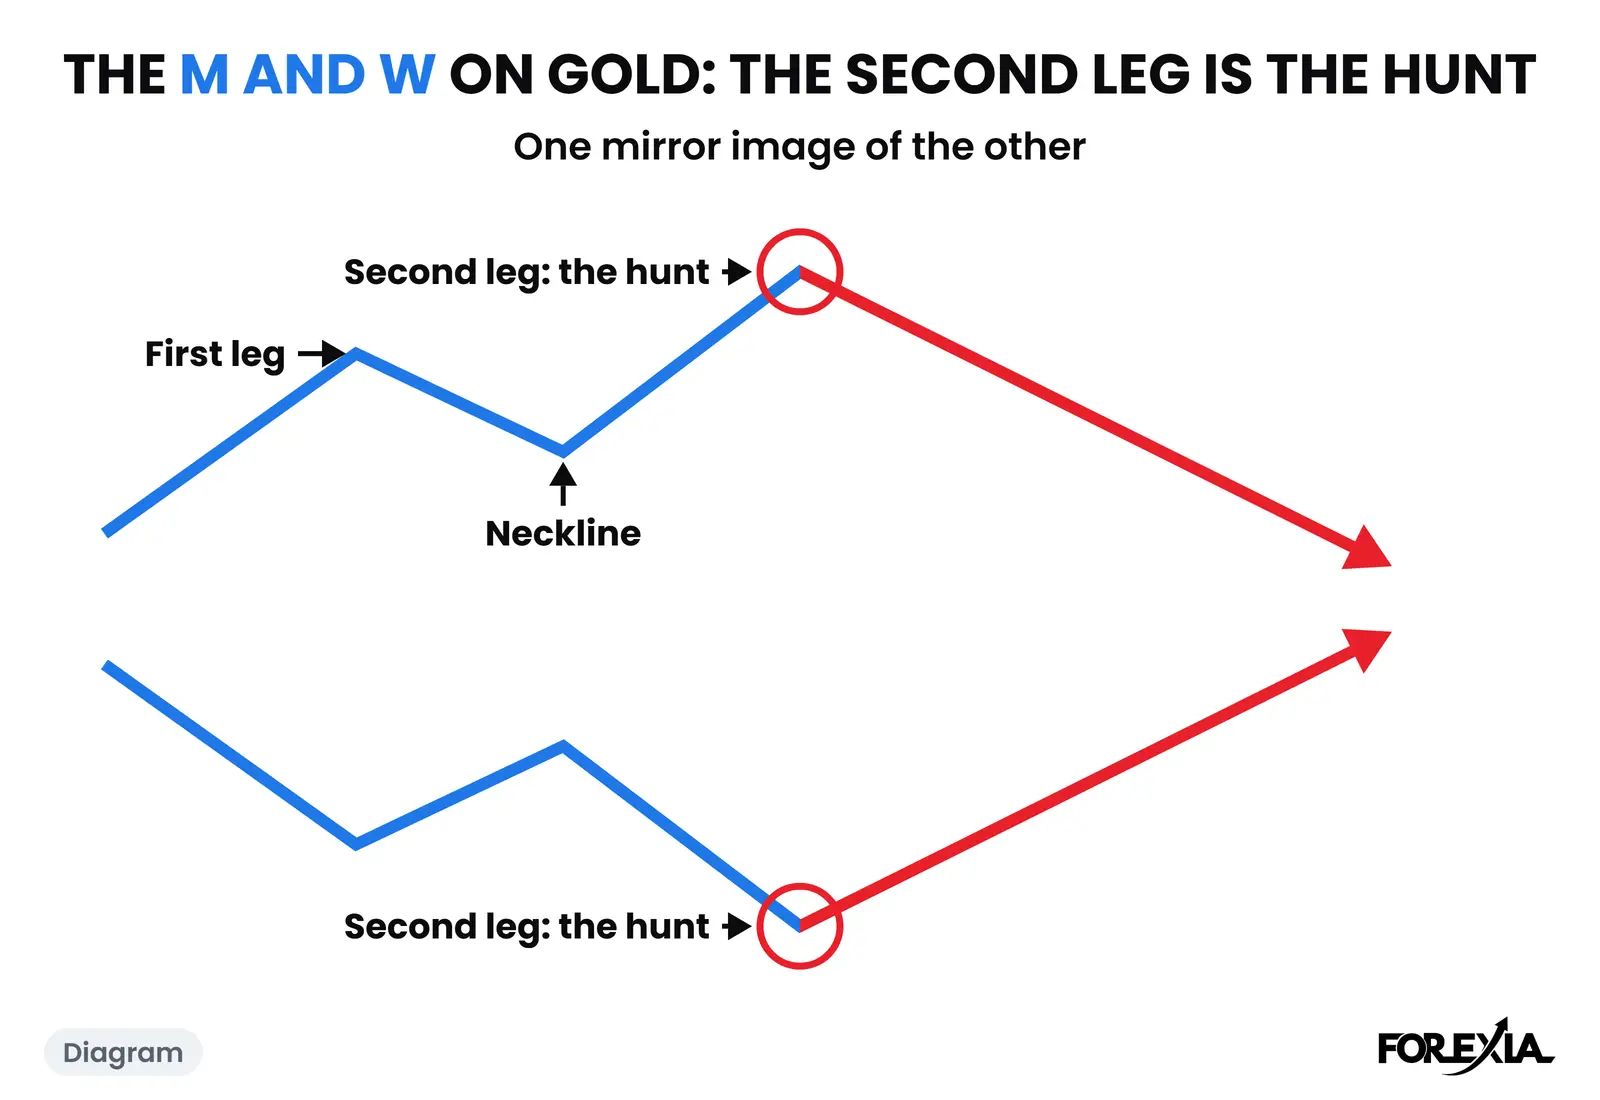
And on GBP/USD, 13 to 16 October 2026
The count of 13 October had the pound's large speculators net short 106,964 contracts, index 0, the most short in three years. On Wednesday 14 October, US inflation data came at 08:30 and the pound fell to 1.31366 at 11:00, 48 pips under the low of 8 October at 1.31843, and closed at 1.31919. The next session's first candle, at 17:00, reached 1.31835, and from there the pound rose to 1.3278 at 14:00 on Thursday, closing at 1.32742.
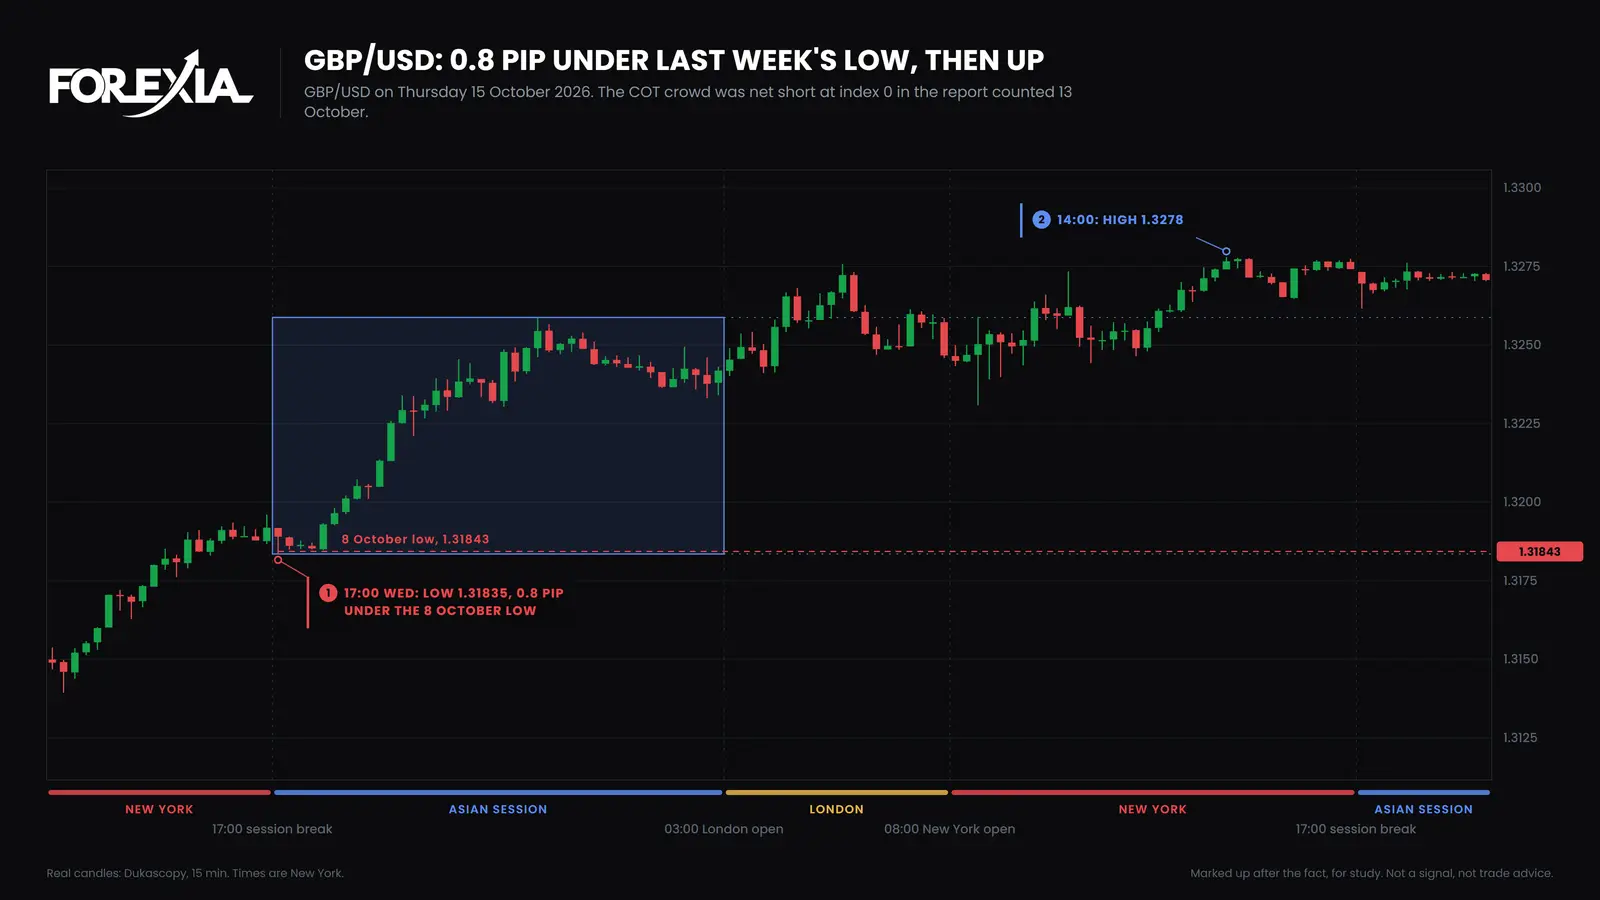
All of that happened before the report was published at 15:30 on Friday 16 October, when the pound stood near 1.3328. A reader who waited for the release saw the crowd at index 0 with the hunt already over. We read the move under the low and back as the stop hunt and the close back, and the report holds no stop orders, so that is a reading of the structure. The point here is only the order of events: the turn came before the data did.
So is Tuesday data still useful?
Yes for where the crowd stands, and no for when. The two days above show the second, and the 1,240 changes show the first. A reading at an extreme tends to be at an extreme still a week later, so the lag costs little if you are asking which side is crowded. It costs a lot if you want to know whether price has already turned, because the answer is on the chart, and the report cannot tell you.
That fits how we read it. At 20 or under, or 80 or over, we call the large speculators crowded and read that as the side not to join, which is Fade the Crowd. It is a label of where they stand, and it is not an entry. In our own test of the report, joining a crowded side lost in 12 of 16 years, and fading it is promising and not proven. Read it as a map, not a clock.
From the three seats, the same lag reads three ways:
- Retail sees Friday's report as news, a fresh view of what the funds are doing now, and trades it.
- The market maker, as we read it, was never waiting for the report. The levels and the crowd's stops were already on the chart.
- The observer sees a position as of Tuesday, with its age beside it, and does not trade the weekday.
How do you read the report so the lag does not hurt?
Five habits cover most of it.
- Read the date at the top, not the weekday. A report counted on Tuesday 10 November came out on Monday 16 November, and it is six days old on release.
- Put the count day on your chart. Mark Tuesday's close and see what price did after it before you read anything into the position.
- Use the index, not the net. A position that is slow to move on a share of open interest is easier to compare with its own past than a raw count, as what the COT index means explains.
- Treat a change of label as news a week late. If the index crosses a line, you learn it on a Friday about a Tuesday.
- Do not ask the report for timing. How to read the COT report works a real row, and none of it gives a date.
What does this check not show?
It does not show that a crowded reading predicts price. It counts how the position moves and not what price does with it. The 1,240 changes are one sample, 156 reports on eight markets from 2023 to 2026, in one report, the legacy one, and a different group or window would give different figures. The two dated days are examples and were picked afterwards. A report built after the fact, as the ones published before 2 October 2026 on our own page were, carries the same limit.
Course 1 of ForexiaPRO, Reading the Map, teaches this read in lesson 1.3.4, Reading This Week's Report.
Frequently asked questions
Is the COT report lagging?
Yes. The positions are counted on Tuesday and published on Friday at 15:30 New York time, so they are three days old at release. A report that a federal holiday moves to a Monday is six days old, and by the next Friday every report is ten days old. Spot forex is not in it at all.
How much does the COT index change in a week?
Usually little. Across the seven majors and gold, in 1,240 week-to-week changes in the 156 reports to 29 September 2026, the index moved a median of 4 points and 12 points or fewer in nine weeks of ten. The largest move was 58 points. The crowded or not-crowded label changed in 157 of the 1,240 comparisons.
Does the lag make the COT report useless for short-term trading?
It makes it useless for timing. Price can move a long way between Tuesday and Friday, as USD/JPY did on 30 July 2026, when it fell 578 pips from its high the day before a report that still showed the crowd long. What the report can still say is where the large speculators stood, and that changes slowly.
Is there a faster version of the COT report?
Not from the CFTC in this report. It counts one Tuesday a week and publishes on the Friday. Anything that claims to show the position sooner is an estimate, and this page does not use one.