Gann Levels Backtest: Nothing on 35 Markets, and No Gann Edge on 40 Kept Back
Dylan Forexia8 min read
Our Gann levels backtest found nothing: Square of Nine levels, the 50% level, day counts from tops and bottoms, and squaring price and time all failed to make money, and markets did not turn at his numbers any more often than at the numbers next to them. His trend-following rules made a small gain up to 2020 and about zero since, and a plain breakout with no Gann in it did as well or better.
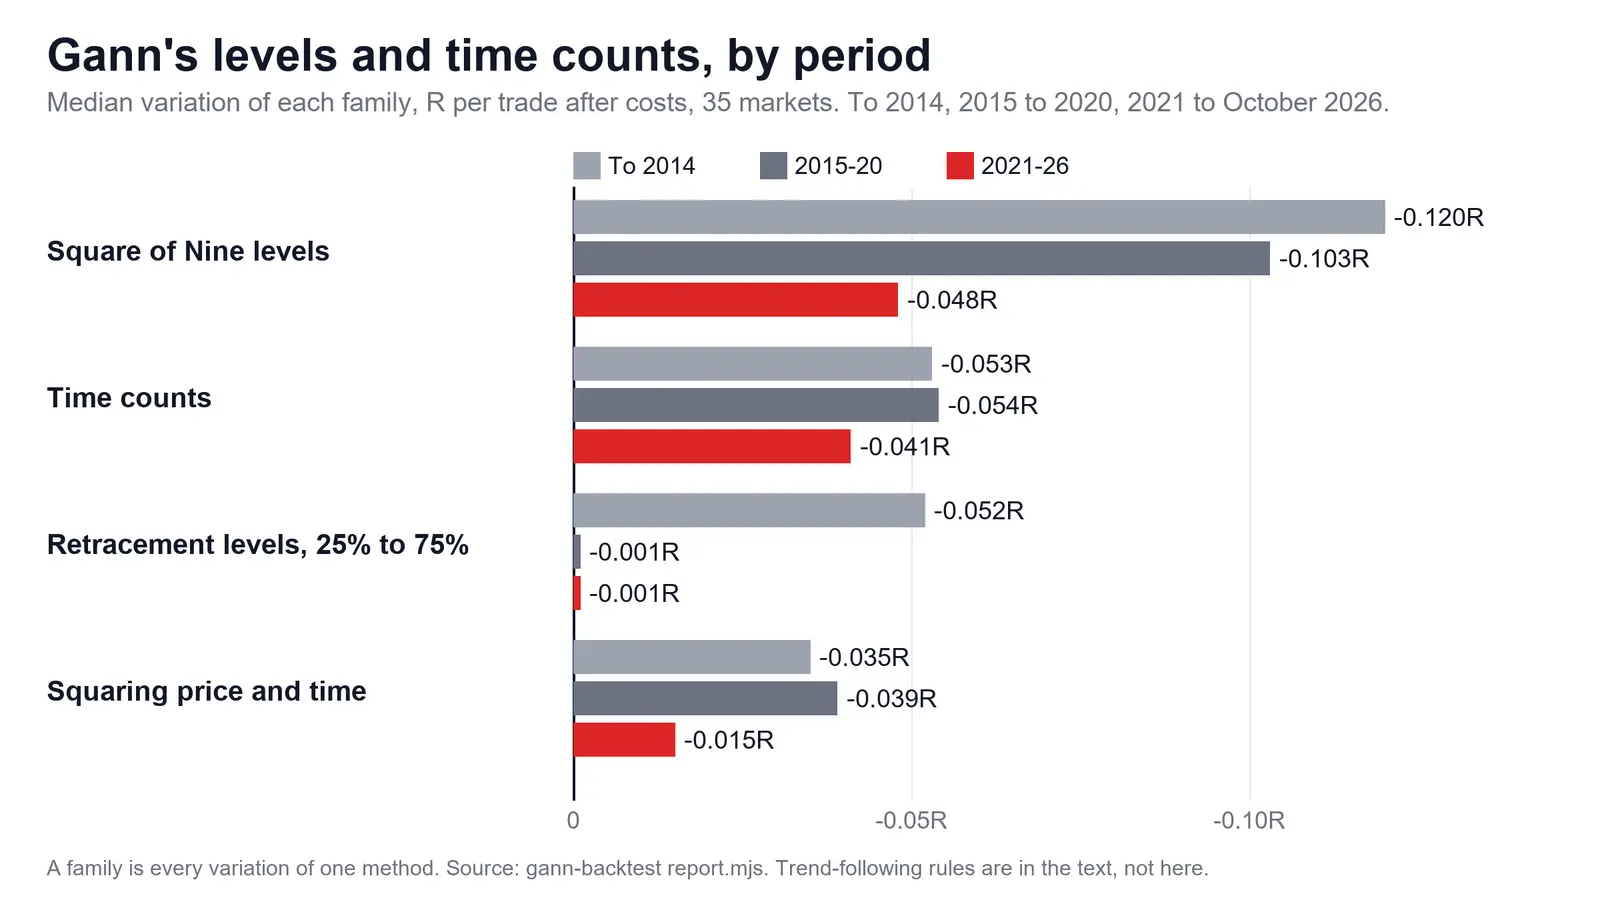
R is a trade's result as a multiple of what it risked, after costs. Tested 10 October 2026. The chart shows the methods the search phrase means: levels and time counts, family by family.
How was the Gann levels backtest run?
Seven of Gann's methods were written out as rules a machine can follow, each with a control beside it. These are his published methods, so the rules are public. Sizes are in ATR, the 20-bar average range, so one rule fits a currency, a stock and a grain. Pivots are used only from the bar that confirmed them.
| First set, 35 markets | Seven forex majors, gold, 8 stock indices, 8 stocks, Bitcoin and Ether, 9 other commodities |
| Kept back, 40 markets | 10 forex crosses, 8 more indices, 10 more stocks, 6 more coins, 6 more commodities |
| Bars | Daily and weekly |
| Data | Forex and gold from Dukascopy's 5-minute bid and ask from 2011-12; everything else Yahoo's daily history, from 1990 at the earliest |
| Costs, round trip | 0.015% forex majors, 0.025% gold, 0.03% indices and crosses, 0.06% stocks, 0.1% commodities, 0.2% coins |
| Periods | A to 2014, B 2015 to 2020, C 2021 to October 2026 |
The 75 in this page's address needs a plain reading. All 2,177 variations ran on the first 35 markets, six of them a plain channel breakout as a yardstick. Only the three best rules, frozen, and that yardstick ran on the 40 kept-back markets, with the pass mark written first. No Square of Nine or time rule got that far, because none got through the first stage.
What did each Gann method do?
The level and time methods lost, and the trend-following ones earned what plain trend following earns. Figures are the typical variation for periods A / B / C. A small gain is given in words.
| Method | Variations | Result |
|---|---|---|
| Square of Nine levels | 576 | -0.12R / -0.10R / -0.05R, negative at every degree |
| The 50% level itself | 480 in the family | -0.07R / -0.08R / -0.01R |
| Time counts | 84 | Gann's counts -0.05R to -0.02R |
| Squaring price and time | 320 | -0.03R at the square |
| Signal day | 16 | -0.13R / -0.03R / -0.13R |
| Double and triple tops | 128 | 0.00R / -0.04R / 0.00R |
| Sections | 60 | -0.09R, a small gain, then -0.02R |
| Swing chart breakout | 108 | Small gains, then -0.01R in C |
| Riding an angle | 324 in the family | Small gains, then -0.01R in C |
| Overbalance | 48 | Small gains, then 0.00R in C |
| Buying the reaction | 27 | Small gain, zero, small gain |
The controls are what make this a finding. On the Square of Nine, 90, 180, 270 and 360 degrees did no better than 75, 165 or 255. Not one variation got through period A. On time, invented counts lost -0.07R to -0.03R and no date at all lost -0.06R to -0.04R: fading an extreme loses the same whichever day it is. Counts of 0.5, 0.71, 1.41 and 2 times the true square lost -0.01R to -0.05R, the same as the square.
On the 50% rule, deeper levels were worse. Only shallow pullbacks of 25% to 38% stayed above zero across periods, and that is buying strength, not buying the half. Angles showed no effect from any scale, size or steepness. "One unit of price" was never fixed by Gann, so three ways of setting it were tried, and every setting gave the same small number.
Do markets actually turn at Gann's numbers?
No. This part has no trading rule in it. We took every swing's turning points and measured them against his numbers and against the places next door.
- Square of Nine. Of 13,238 swings, 22.4% ended within 5 degrees of a 45-degree multiple. Chance is 22.2%, and 22.8% ended in the gaps between them.
- Retracements. Between 5.7% and 6.9% of pullbacks stopped within 2.5 points of 50%, while the bands on either side held 6.5% to 8.3%. There is no bump at 50%, 38.2%, 61.8%, a third or two thirds.
- Time. Turns 90, 180, 270 or 360 days apart: 1,862, against 1,803 a week or two either side, which is within noise. The one-year count was under its neighbours, at 259 against 288. His eighths and thirds were under theirs. A two-year count was above on the smallest turns, 23 against 13, and not clearly on the larger ones, 50 against 60 and 21 against 19.
- Price and time. A bigger swing is followed by a slightly shorter next swing (rank correlation -0.12 to -0.18), the opposite of time growing with price.
- The ten-year pattern. On the S&P 500 from 1929, years ending in 5 were up 9 of 10, but his panic years in 7 and weak years in 0 held only before 1975. Five to ten cases a digit is far too few to trade.
Shuffled candles give the same figures on the first four, and that is what "no effect" looks like.
What happened on the 40 kept-back markets?
Nothing that belongs to Gann held. With 2,177 variations, some will look good by accident, so a variation had to be chosen on period A, hold on B, and only then be read on C. 43 passed all three. The same test on shuffled candles passes about 15, so most of that is what the method lets through by chance, and the rest is trend following.
The three best were then frozen and run on the 40 markets, with the pass mark written down before they were downloaded.
| Frozen rule | Period C (2021 on) | Verdict |
|---|---|---|
| Shallow pullback, 38.2% | Not clear of zero, and zero over the whole record once each market's own drift is taken out | Fail |
| 2-bar swing breakout | 0.00R | Passes the letter over the whole record, nothing since 2021 |
| Reaction in an uptrend | -0.02R | Fail |
The plain 20-day channel breakout, with no Gann in it, beat all three on the same markets.
Where did anything hold?
One pocket did: trend following on crypto, and we would not credit Gann with it. His swing breakout on Bitcoin and Ether, and again on six coins kept back, stayed above zero from 2021 on. Read it with these beside it.
- A plain channel breakout did the same or better, so this is any breakout doing what breakouts do.
- It is fading. Each period is a fraction of the one before, and 2025 was flat to down.
- The coins were picked today, so they are the ones that survived and grew.
- The coins move together, so about 700 trades are far fewer independent bets than they look.
- The costs are in, and funding on a held short or leveraged long is not.
All of the swing rule's gain across markets came from longs, and its shorts lost. It was paid by markets that rose.
What about Gann levels on forex and gold?
On forex they showed nothing. On the seven majors no family's typical variation got clear of zero, with time counts the worst at -0.061R and Square of Nine at -0.015R. The study's read of the kept-back crosses agrees.
Gold needs reading apart, since the study pools it with commodities. On gold alone Square of Nine levels, time counts and squaring lost: -0.158R, -0.118R and -0.067R. Swing and overbalance rules stayed above zero there, and so did the plain channel and, by less, the retracement family, in a market that rose. That is mostly trend following again, and buying pullbacks in a rise. Our page on gold puts this beside everything else we ran on it.
What does this test not prove?
It does not show that nobody can use Gann's ideas by eye. A rule had to be written for each method, and someone who uses them by judgement will say the rule is not what they do. What can be said is narrower and harder to argue with: the levels and dates, measured directly, are not where markets turn.
- Daily and weekly bars only. His intraday use is not tested.
- Some of his work is left out. Astrology and his natural-number tables (the Square of 144, the hexagon chart, planetary lines) were not run.
- Commodity futures are the front contract, with roll gaps nobody could trade.
- Stocks are split-adjusted, so their Square of Nine tests run on prices that never printed. Forex, indices and coins are true prices.
- Forex and gold start in 2011-12, so their period A is about three years.
- Index results are on the cash index, which cannot be traded directly.
This is not a claim that other levels are magic. Liquidity mapping reads levels because orders plausibly rest at prior highs and lows, and that too is a reading. Our own setup, run as a rule, also lost. So did twenty published strategy tests. A more common idea is checked in does the London breakout work, and why strategies fail backtests pulls the reasons together. The rest is on the research page.
What changed when this page came back?
This page was taken down on 31 October 2026 and put back on 11 November 2026. Its figures were rerun on 11 November 2026 with scripts/seo-research-figures.mjs and gann-backtest/report.mjs. The family results match. One range was corrected to the study's own README: Gann's time counts are -0.05R to -0.02R, where the first version said -0.07R to -0.02R. No finding was reworded to read better than the numbers.
Course 1 of ForexiaPRO, Reading the Map, teaches liquidity mapping from lesson 1.2.1, on levels of that kind and none of Gann's.
Frequently asked questions
Do Gann levels work?
Not in our test. As written rules, Square of Nine levels, the 50% level and his time counts lost money after costs on 35 markets. Measured directly, turning points did not land on his numbers any more often than on the numbers next to them. Shuffled candles gave the same figures.
Do Gann angles work?
Riding an angle made a small gain up to 2020 and about zero since. No scale, size or steepness stood out, which is what a trend-following rule with an arbitrary line would give. A plain 20-day channel breakout with no Gann in it did as well or better in every period.
Do Gann's time counts work in forex?
Fading an extreme on his counts lost, and it lost about the same on counts he never named, and on no date at all. On the seven majors the time family's typical variation was -0.061R a trade over the whole record, the worst of any family there.
Was all of this tested on 75 markets?
No, and the difference matters. All 2,177 variations ran on 35 markets. Only the three best rules, frozen, and one plain yardstick then ran on 40 kept-back markets, because the pass mark allowed nothing else. No Square of Nine or time rule reached that stage, since none passed the first.