M and W Pattern vs Double Top: Same Shape, a Different Question
Dylan Forexia7 min read
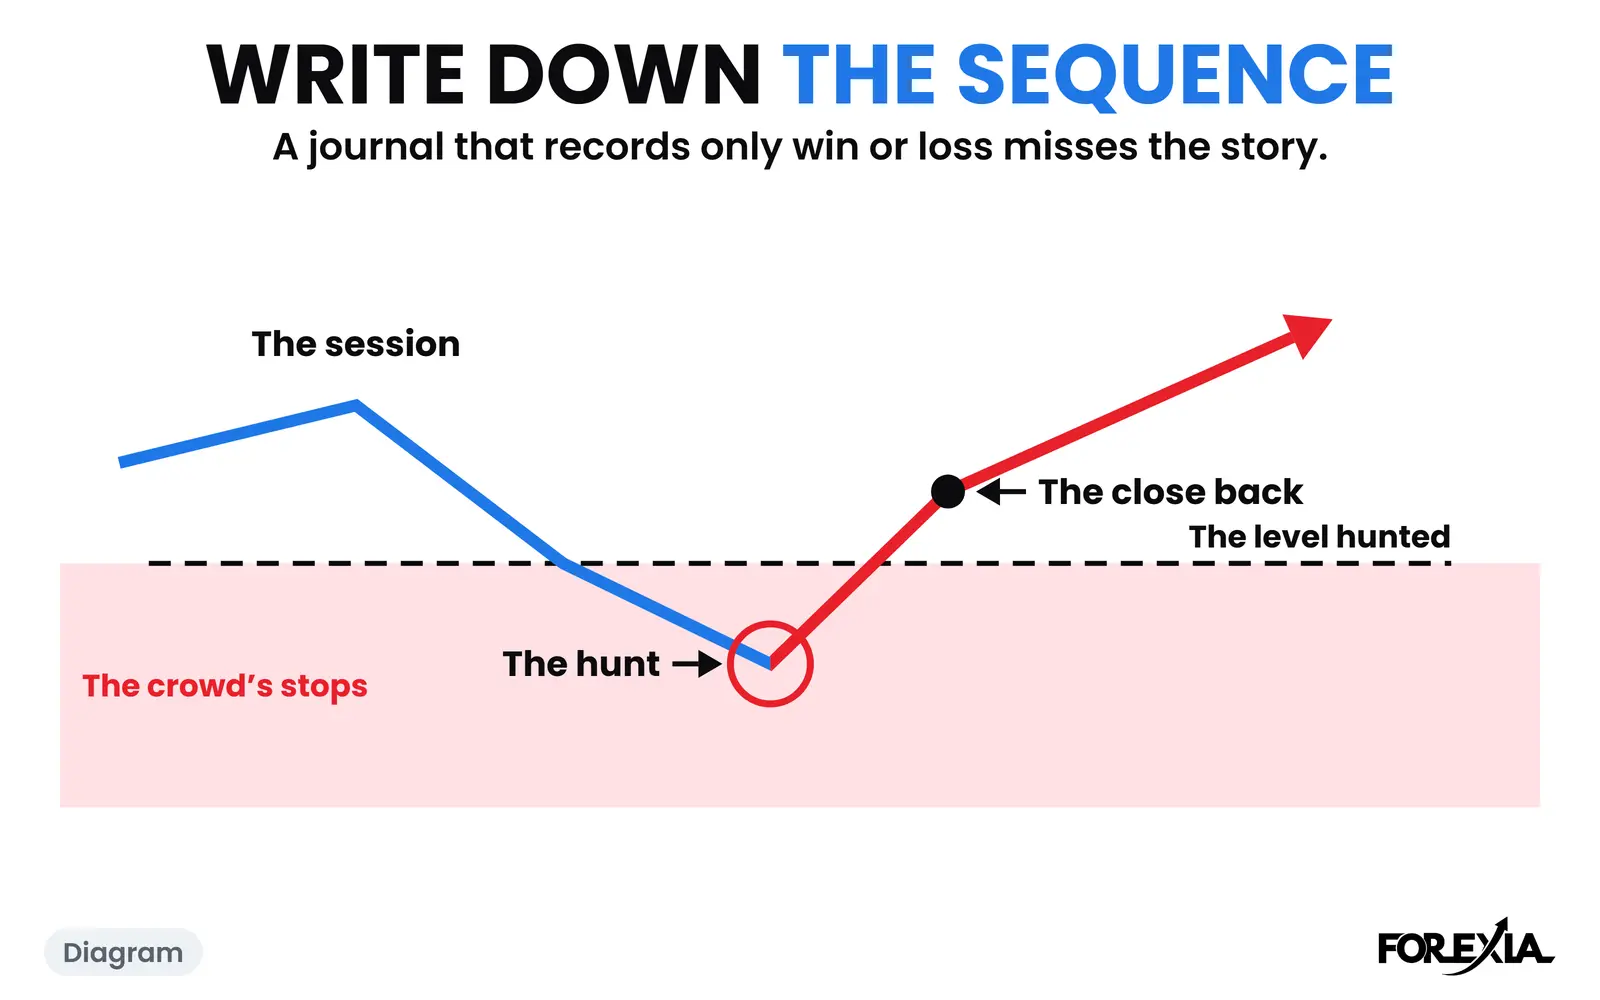
M and W pattern vs double top: on a chart they are the same two peaks or two troughs, and the difference is in what you ask of them. The book asks whether the neckline has broken. We ask whose stops sit past the first leg, and whether the second leg went to get them. Neither name predicts the next candle.
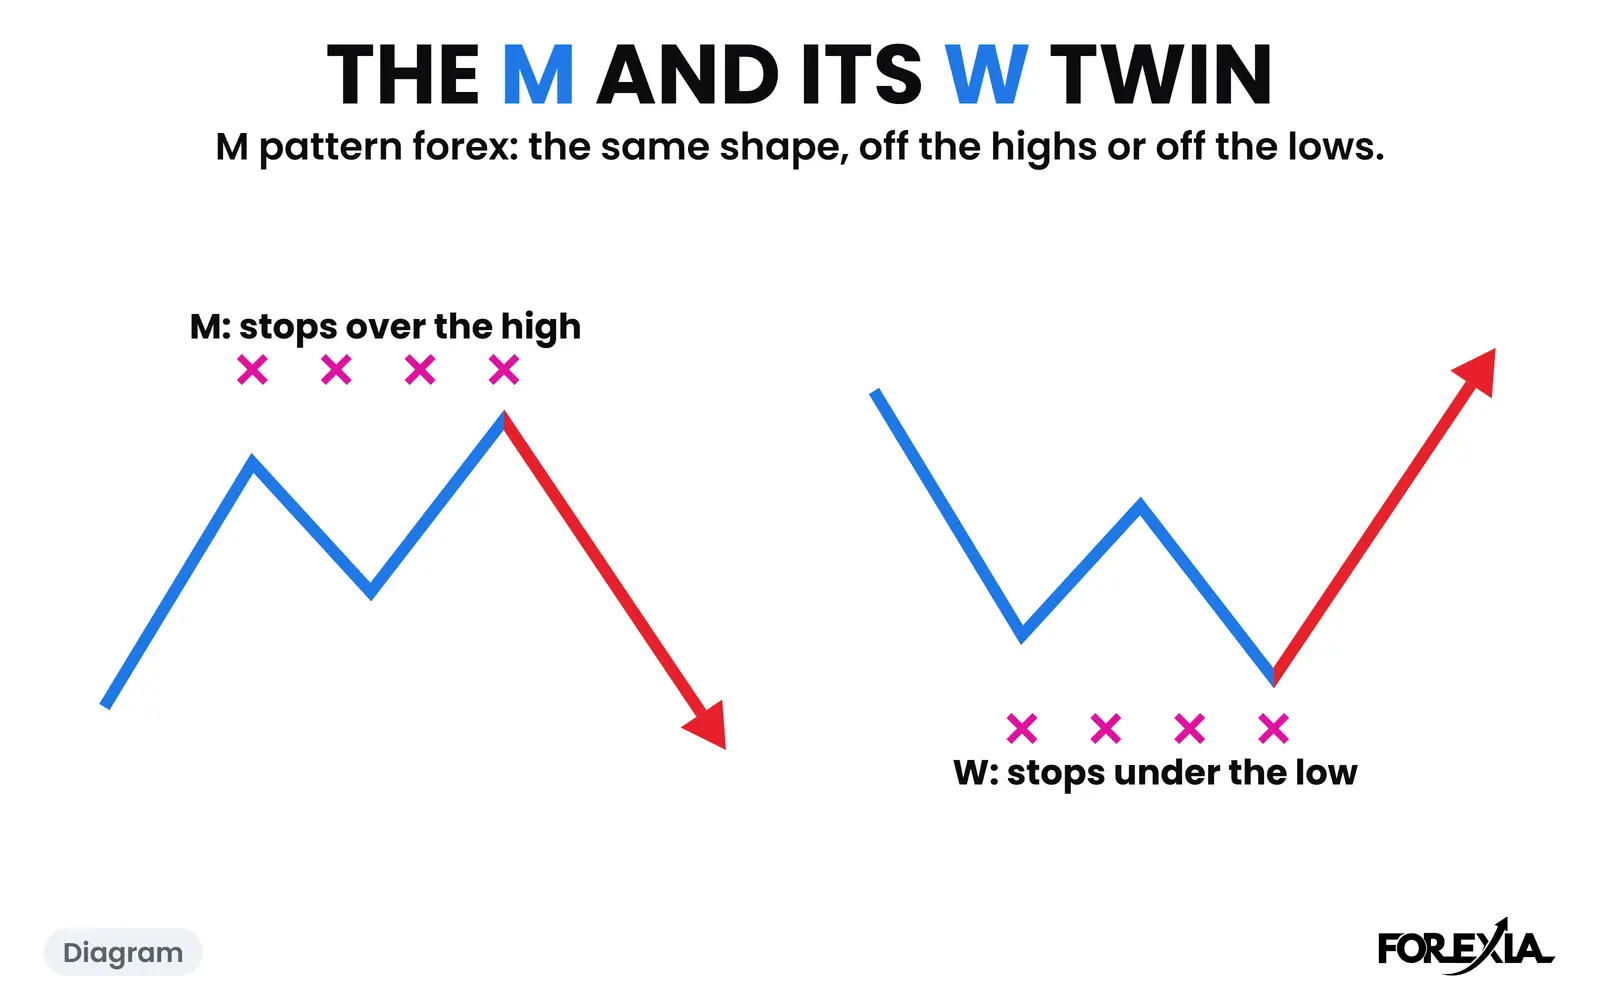
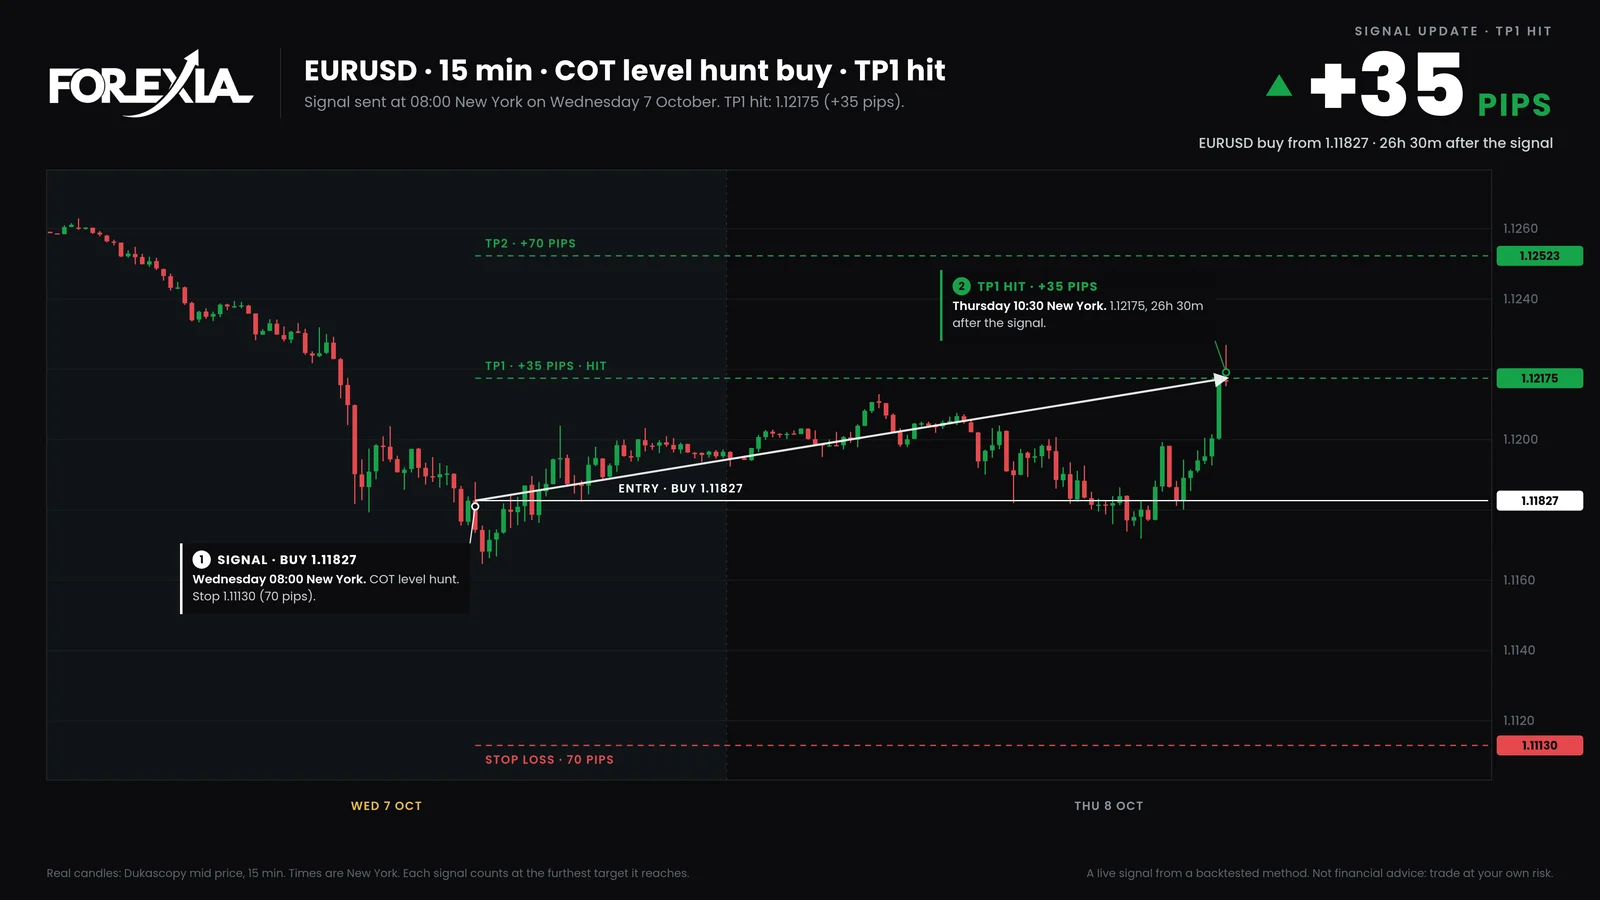
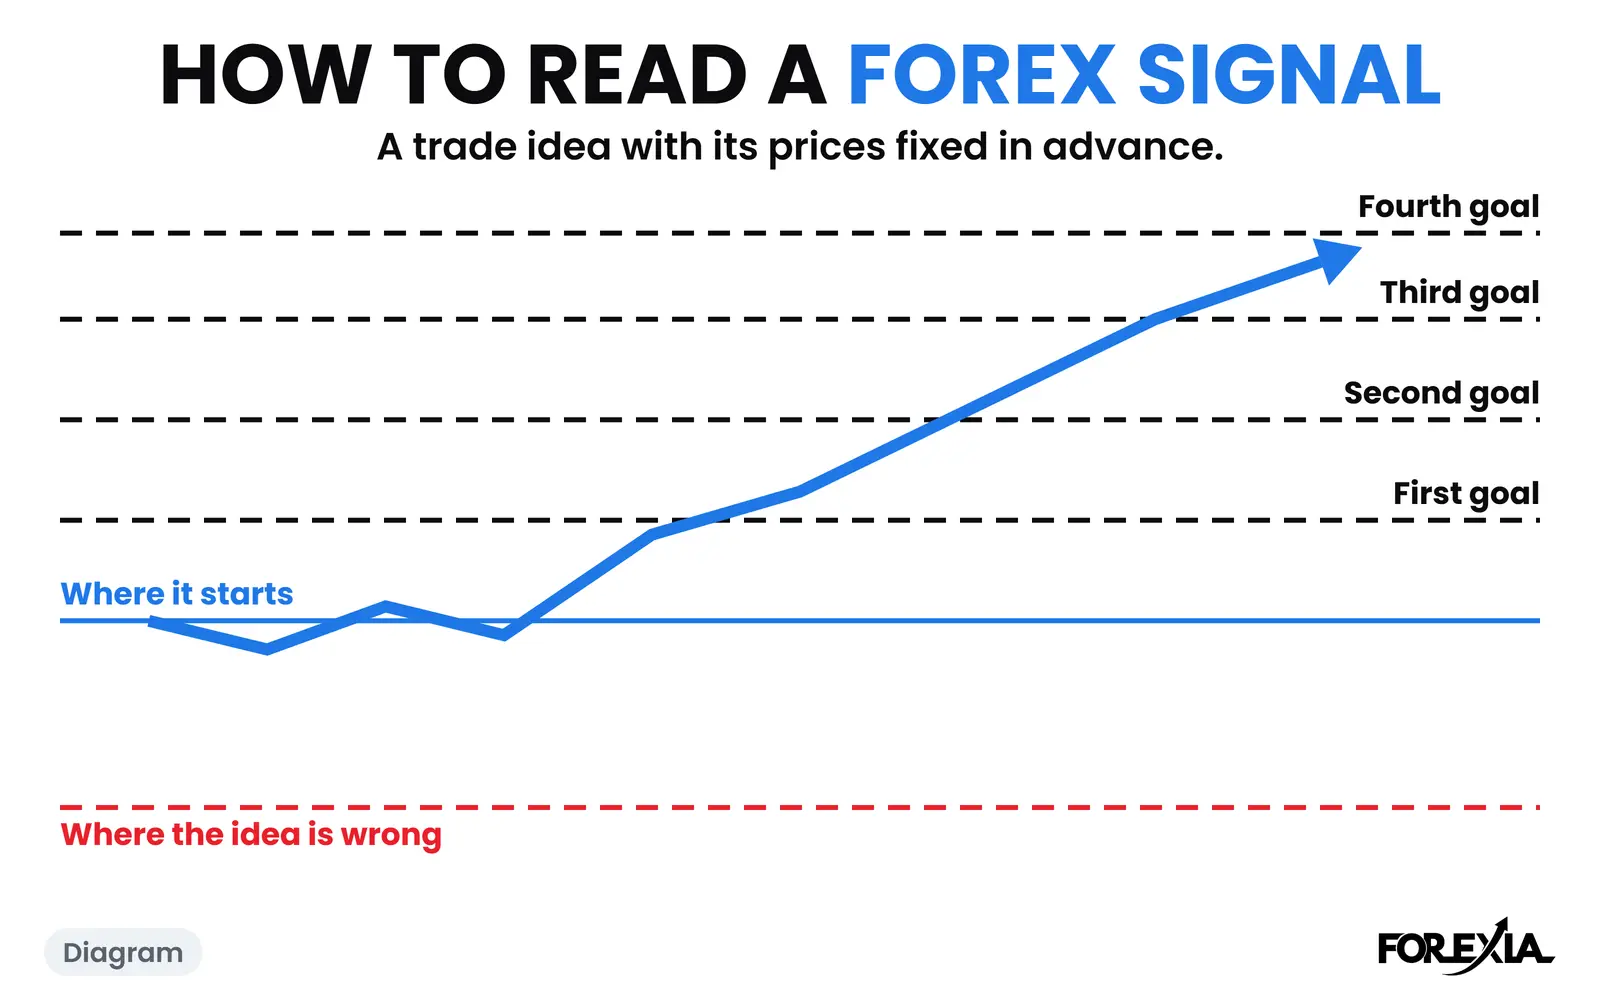
The shapes are on our guide to the M pattern in forex, and their failures are on why double tops and double bottoms fail. This page puts the two names side by side, with a real day for each. It gives no entry, stop or target of ours.
What is a double top in the books?
It is two peaks at about the same price with a dip between them. The dip is the neckline. The book's trade is to sell when price closes under the neckline, put the stop above the peaks, and aim for the pattern's height measured down from the neckline. A double bottom is the mirror, with a buy over the neckline and the stop under the troughs.
The name describes what has already happened, so the signal comes late by design. The trade only exists once the second peak has formed and price has fallen back through the line the book drew.
What does the M add?
It adds three things the double top leaves out.
- The second leg's hunt. On an M, the first high leaves stops over it, and the second leg is the run through them. In a clean double top the second peak is about level with the first. In an M it often runs a few pips past, and then closes back under.
- The session. We read the shape off the Asian range. A clear box gives the whole market two obvious lines and hours to set orders around them, and the first leg starts from there. A double top on a four-hour chart has no session in it.
- A mirror we keep for the lows. A W is the same read off the lows: the second low runs past the first, takes the buyers' stops, and closes back over.
| Double top or double bottom | M or W | |
|---|---|---|
| What it is | Two peaks or troughs about level, with a neckline | The same shape, read as two legs |
| The second leg | Should stop at about the first | May run past the first |
| What the second leg means | A failed test of the level | The hunt for stops left by the first leg |
| Where it sits | Any chart, any time | Off a clear Asian range, in London or New York |
| When it counts | When the neckline breaks | Only seen afterwards |
What does an M look like on a real day?
USD/JPY on Wednesday 15 July 2026 made one. Asia ran 161.965 to 162.259, a box of 29 pips. London broke the top of it, and by 04:00 price had reached 162.349, 9 pips over: the first leg. Price pulled back to 162.243 at 05:00, a shade inside the box.
At 06:15 price reached 162.421, 7 pips past the first leg. That is the second leg, and by the book it is a double top that failed to stay level. The 06:45 candle closed at 162.325, back under the first leg. US producer prices came at 08:30, and the move ground on to a low of 161.893 at 14:15, 53 pips under the high. By 15:30 price was back at 162.255.
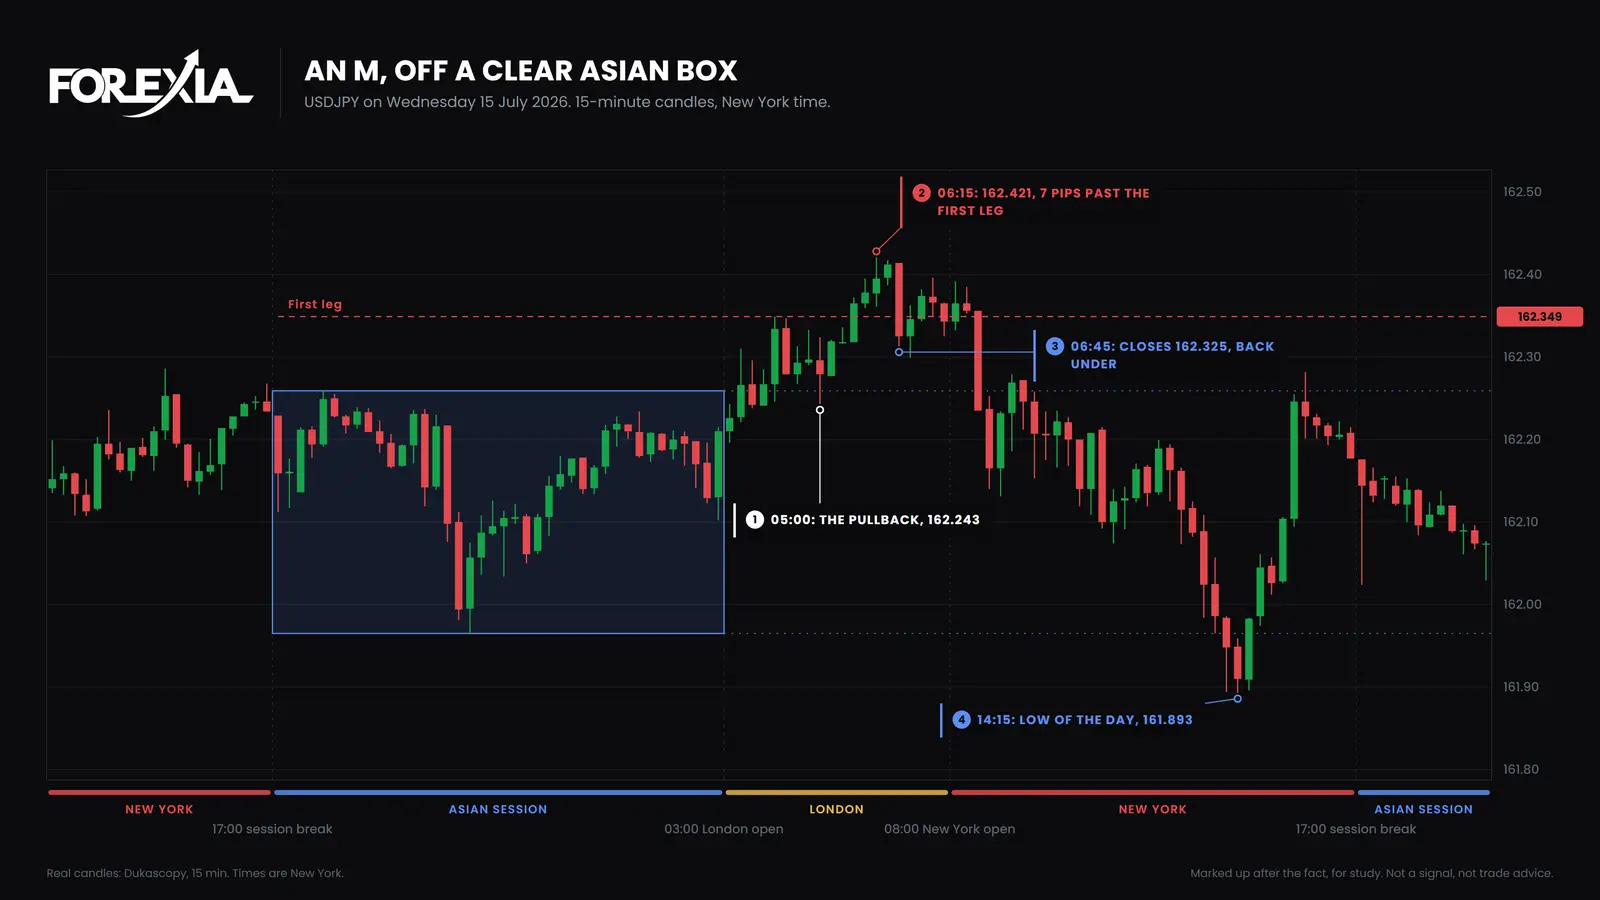
A seller who waited for the double top's neckline signal would have found it only after that run, because the second peak was higher than the first. The reading that fits the day is the stops: the second top did not show stronger resistance, it went through the sellers' exits and only then turned.
What does a W look like on a real day?
Gold on Thursday 27 August 2026 had an Asian box of 49 pips, 4593.94 to 4642.53, with Wednesday's low under it at 4582.78. London went through that low at 05:30, so anyone who had bought it was stopped out before the W had started.
The first leg came at 06:00, at 4568.89. Price pulled back to 4600.86 at 08:00. At 09:45 the second leg reached 4564.23, 5 pips past the first, and closed at 4572.20, back over it. Price rose 54 pips to 4617.94 by 15:00, gave back about a third of that and ended the day at 4600.15.
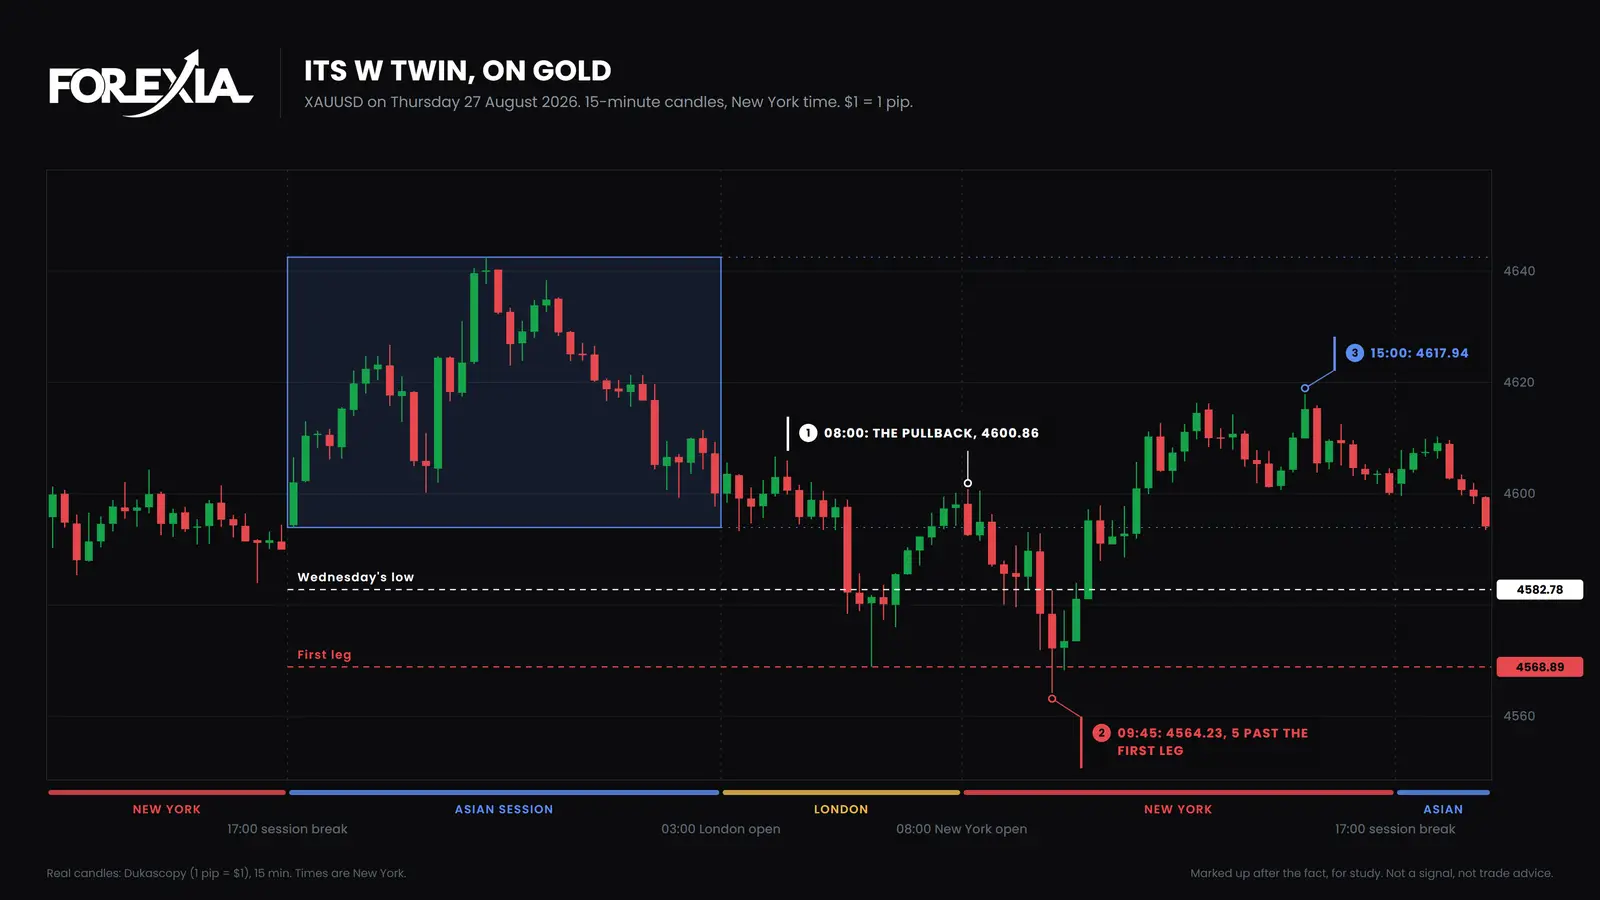
To the book this is a double bottom with a second low that came in lower. To us it is a W because of what the second leg did to the first leg's buyers. It was not a clean run either, and we show it for that reason.
Did the neckline help on a day when it was drawn?
Not on EUR/USD on Friday 28 August 2026. The pattern there was three highs a pip apart, 1.16491, 1.16486 and 1.16494, with a neckline at 1.16392. At 09:45 a candle closed under the neckline at 1.16377, the book's signal, with the stop over the peaks.
The next candle opened at 1.16392 and, in its first minute, ran to 1.16589, 10 pips past the three highs. Then it fell to 1.16102. The low of the day, 1.15777, came at 14:45. A seller with a stop inside those 10 pips never saw it. The Fed chair's speech and the payrolls benchmark revision were both due at 10:00, so the chart shows where price went and not who sent it. The full day, with its chart, is in why double tops and double bottoms fail.
What does the count say about the two readings?
It does not separate them. We counted shapes on 15-minute Dukascopy candles from 6 April to 1 October 2026: 1,030 market-days on seven dollar majors and gold. A shape is two peaks 2 to 12 hours apart in one trading day, about level with each other, with a real dip between. That found 983 shapes, 505 tops and 478 bottoms.
- 680 never closed through the neckline that day before going past the peak.
- 303 closed through the neckline, the book's signal.
- 104 of those 303 went back past the peak before the book's target.
Now the M reading, tested against the shape's own second leg. Where the second peak went past the first, 49 of 147 confirmed shapes went back past the peak before the target. Where it stopped short, 55 of 156 did. That gap is too small to sort the shapes, so the extra run does not mark a better or worse one.
These are shapes on candles, not trades. They include no spread and no judgement, and they say nothing about what a trade would have made. Run as a fixed rule, our own test of the setup did not make money.
What did each seat see?
The three seats read the yen day three ways.
- Retail saw a breakout, a pullback and a second top, and each was a new reason to buy or to sell.
- The market maker's seat, as we read it, saw a crowd on each side of 162.349, one group's exit just over the line and the other's under the pullback. Nobody outside can see those orders, so this seat is an inference.
- The observer saw a line, a run 7 pips past it, and a close back thirty minutes later, and said no more than that.
Common mistakes
Each treats a name as an answer.
- Treating the M as a better double top. It is the same shape. The difference is the question you ask afterwards.
- Reading a second leg that runs further as a failed pattern. The book does. We read it as the pattern, and the count above does not choose between us.
- Drawing it anywhere. A shape with no range under it and no session around it tells you little about whose stops are where.
- Taking a letter as a forecast. Gold's W gave back a third of its rise by the close, and the euro's neckline signal sat under a 10-pip run the other way.
For more dated examples, see a GBP/USD M from August and a gold W from August, and the glossary's M & W Reversals and the Third Tap. Course 3 of ForexiaPRO, Reverse Price Action, teaches the read step by step.
Tools for this
Frequently asked questions
Is an M pattern the same as a double top?
On the chart, yes: two highs at about the same price with a dip between them. The difference is the reading. A double top is called a signal once the neckline breaks. We read an M as a first leg that left stops over its high, and the second leg as the hunt for them.
Is a W pattern the same as a double bottom?
It is the same shape in a mirror, two lows with a rise between them. We use W for the version where the second low runs past the first and closes back, as gold did on 27 August 2026, 5 pips under its first leg.
Which is more reliable, the M or the double top?
We cannot say, and we have no count that sorts them. Of 983 shapes on seven majors and gold from 6 April to 1 October 2026, 680 never closed through the neckline that day. Where the second peak went past the first, 49 of 147 confirmed shapes went back past the peak before the target. Where it stopped short, 55 of 156 did.
Can you trade an M or a double top for profit?
Neither name is a promise. Run as a fixed rule, our own test of the setup did not make money after costs. The days on this page turned, which is why they are here, and a reversal seen afterwards is not a setup.