Trading insights, market analysis, and educational resources
Reverse price action reads a chart from the side of the crowd: where retail orders and stop losses sit, and how price collects them. A visual guide.
Forex chart markups, week by week: stop hunts, M and W formations and midweek reversals on the majors and gold, drawn on real candles.
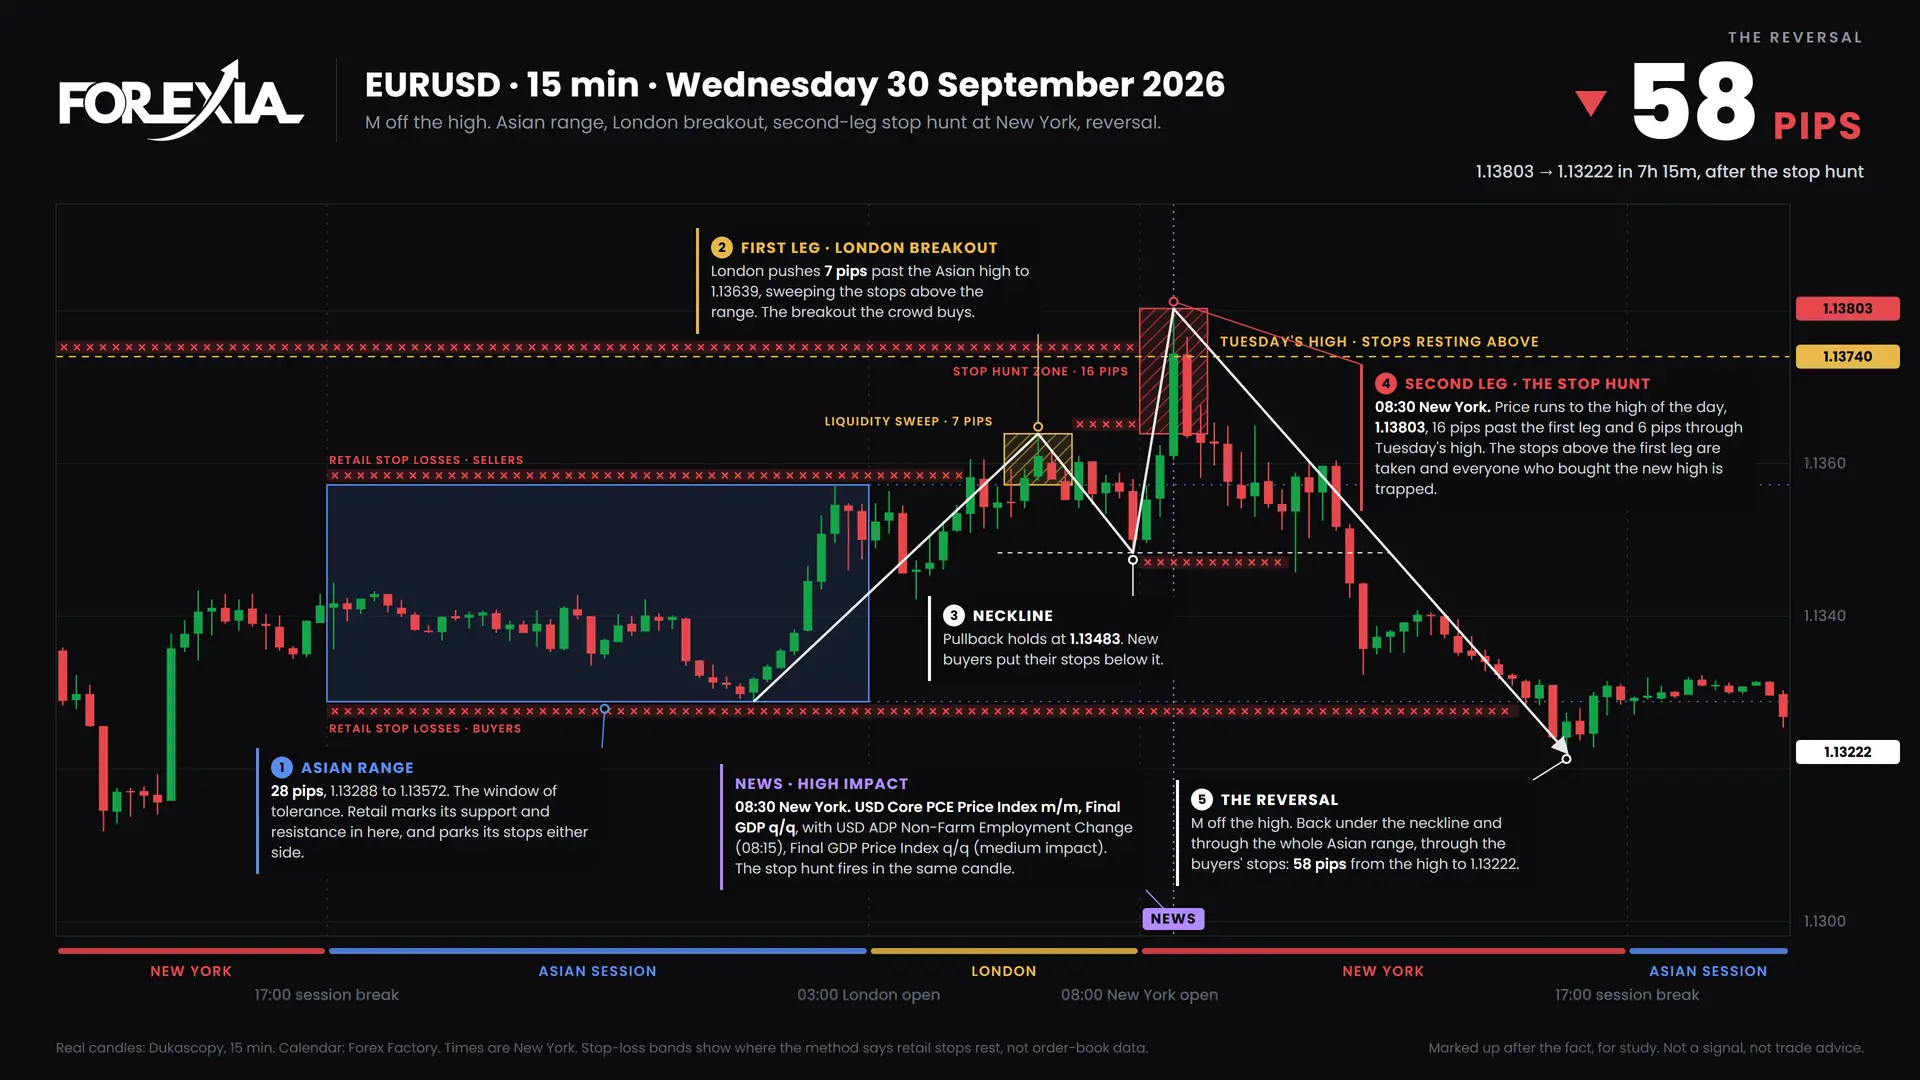
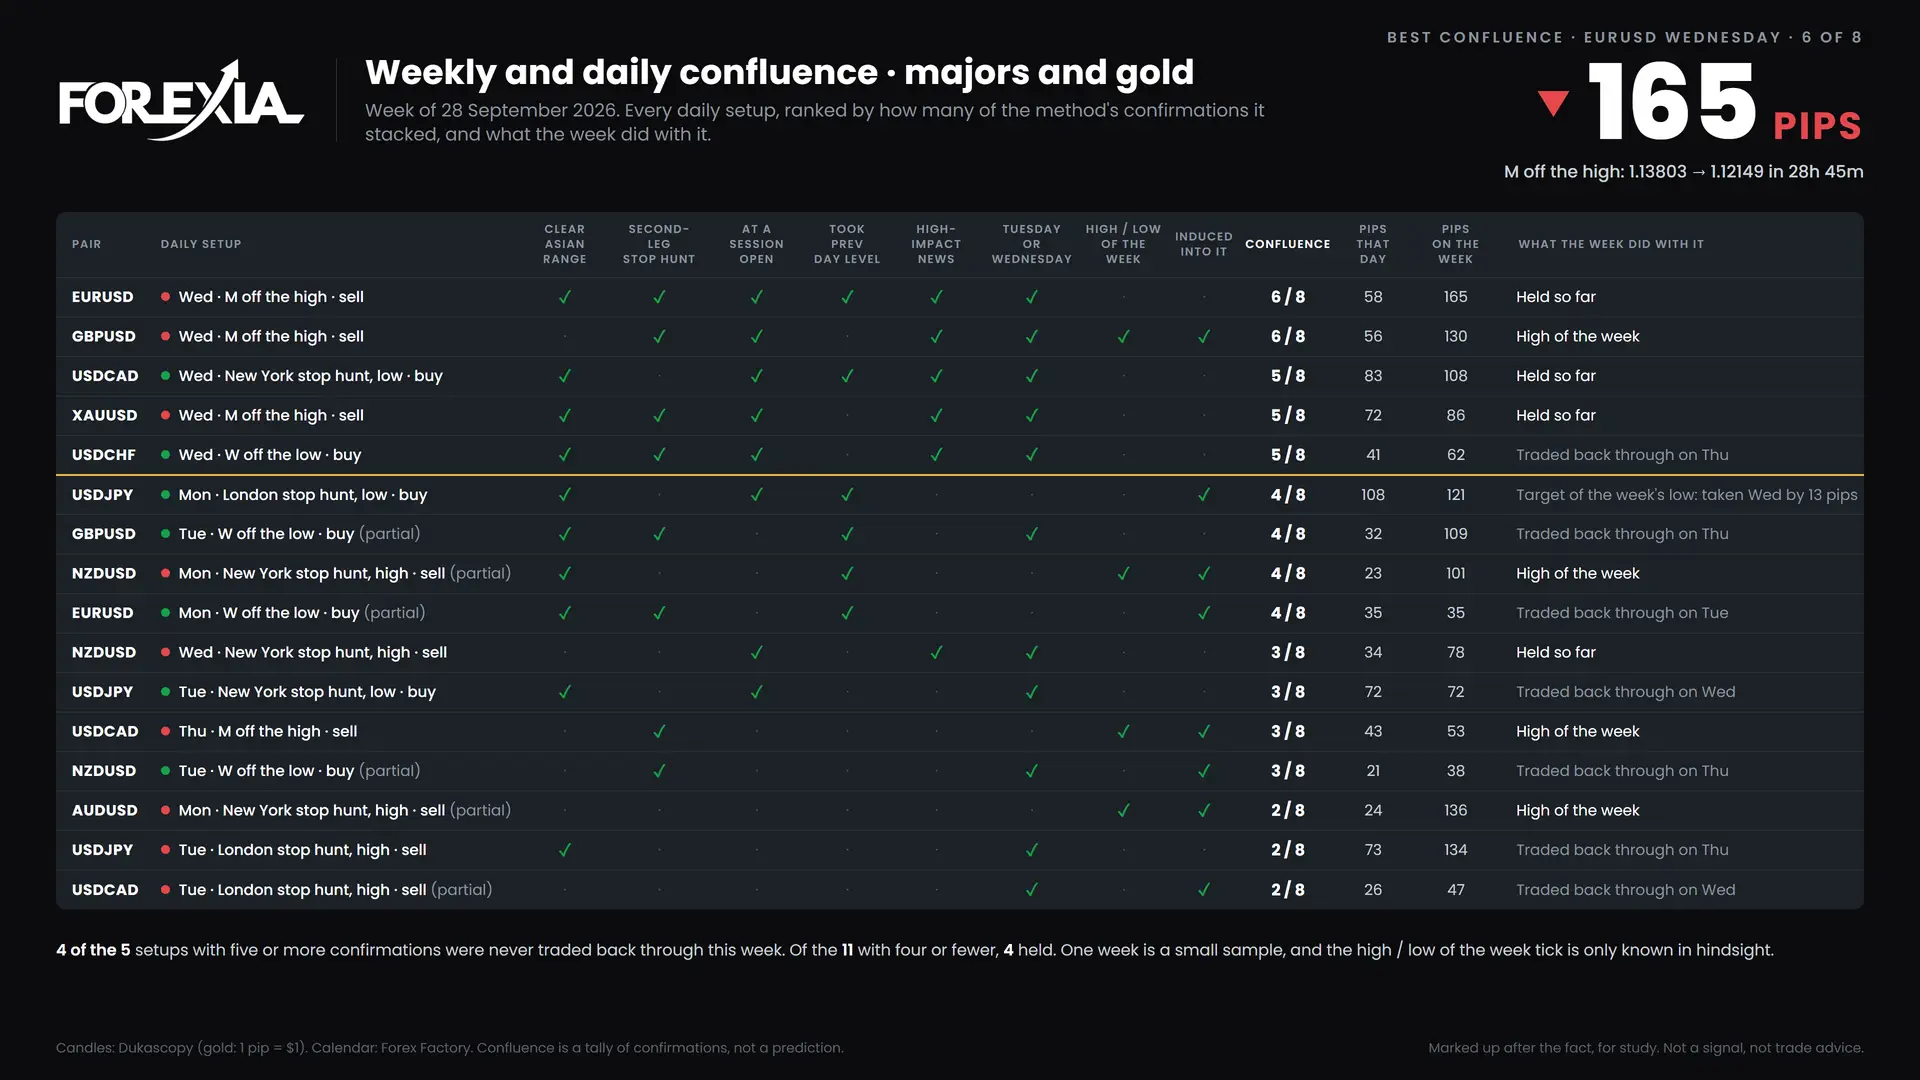
An EURUSD stop hunt through Tuesday's high on US PCE data completed an M formation and fell 165 pips. Chart markups, 28 September 2026.
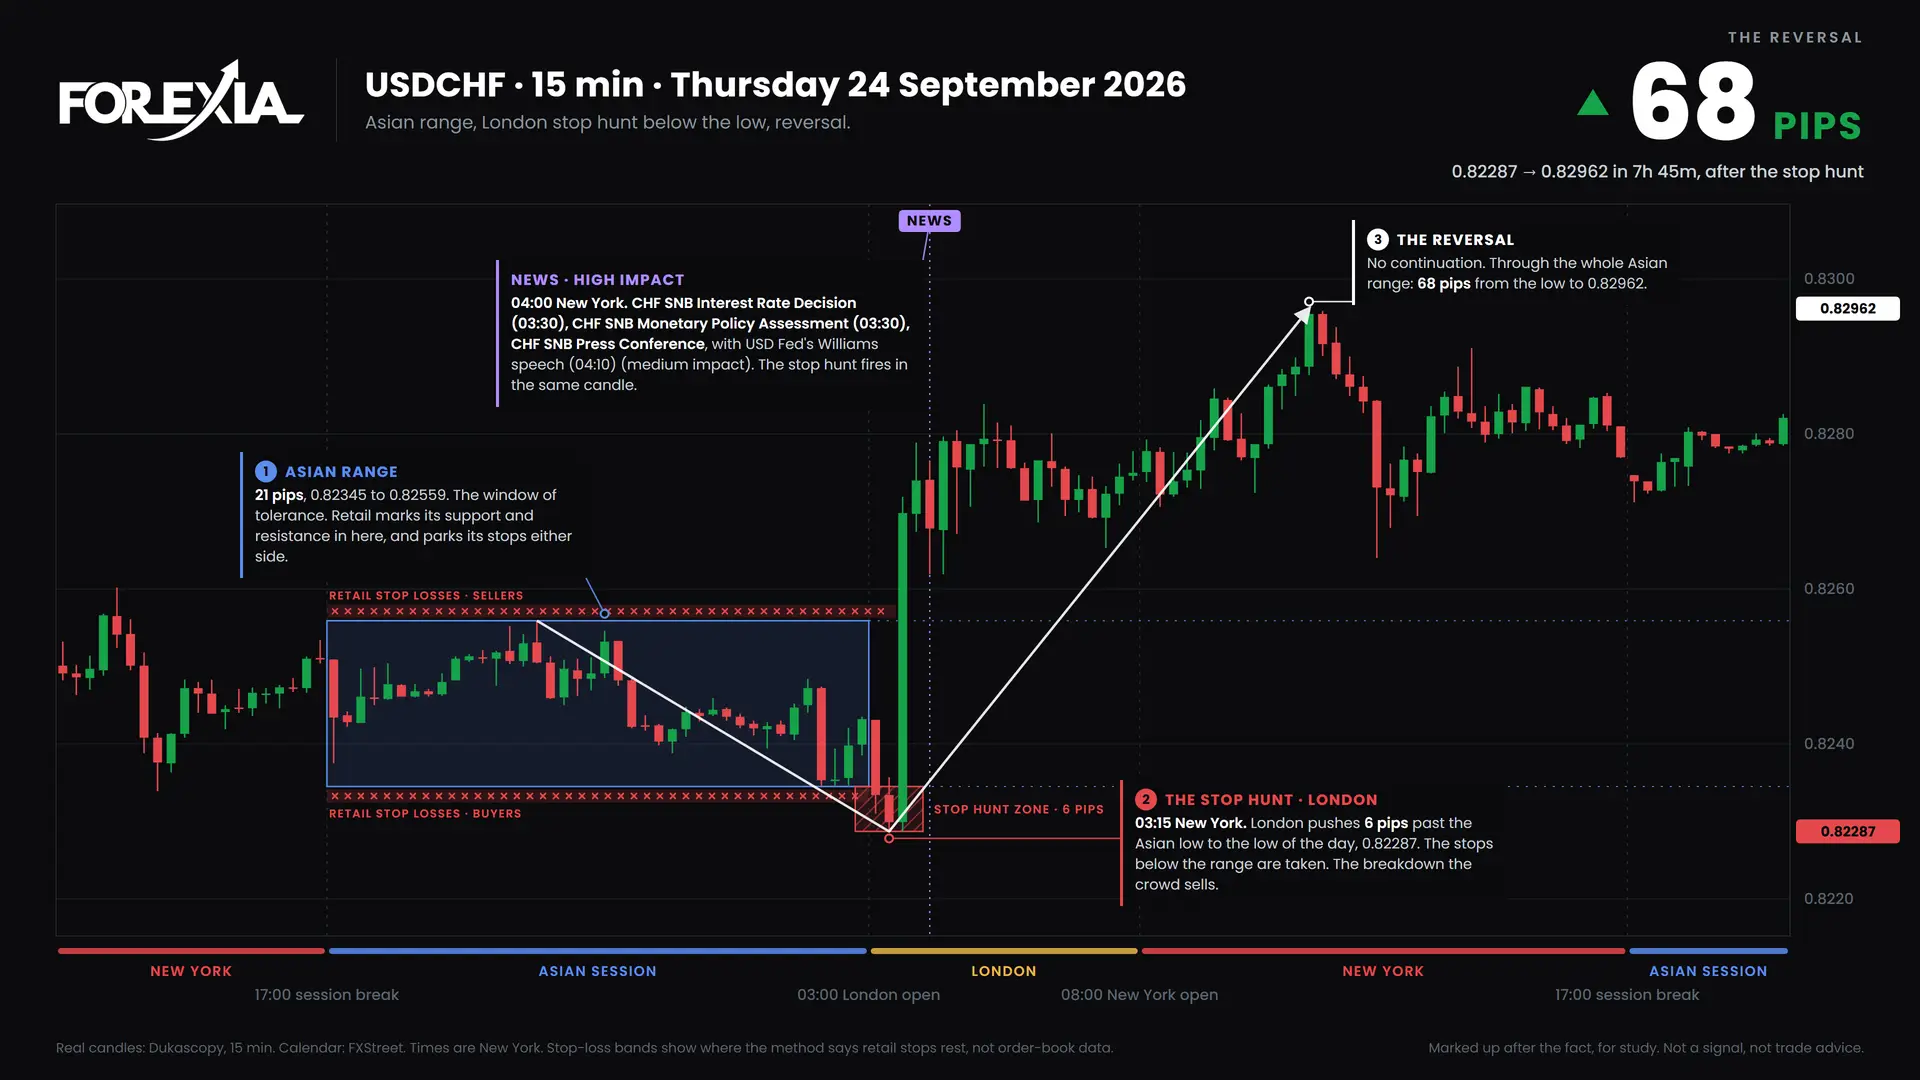
A USDCHF stop hunt fired in the candle of the SNB rate decision and reversed 68 pips. Real chart markups, week of 21 September 2026.
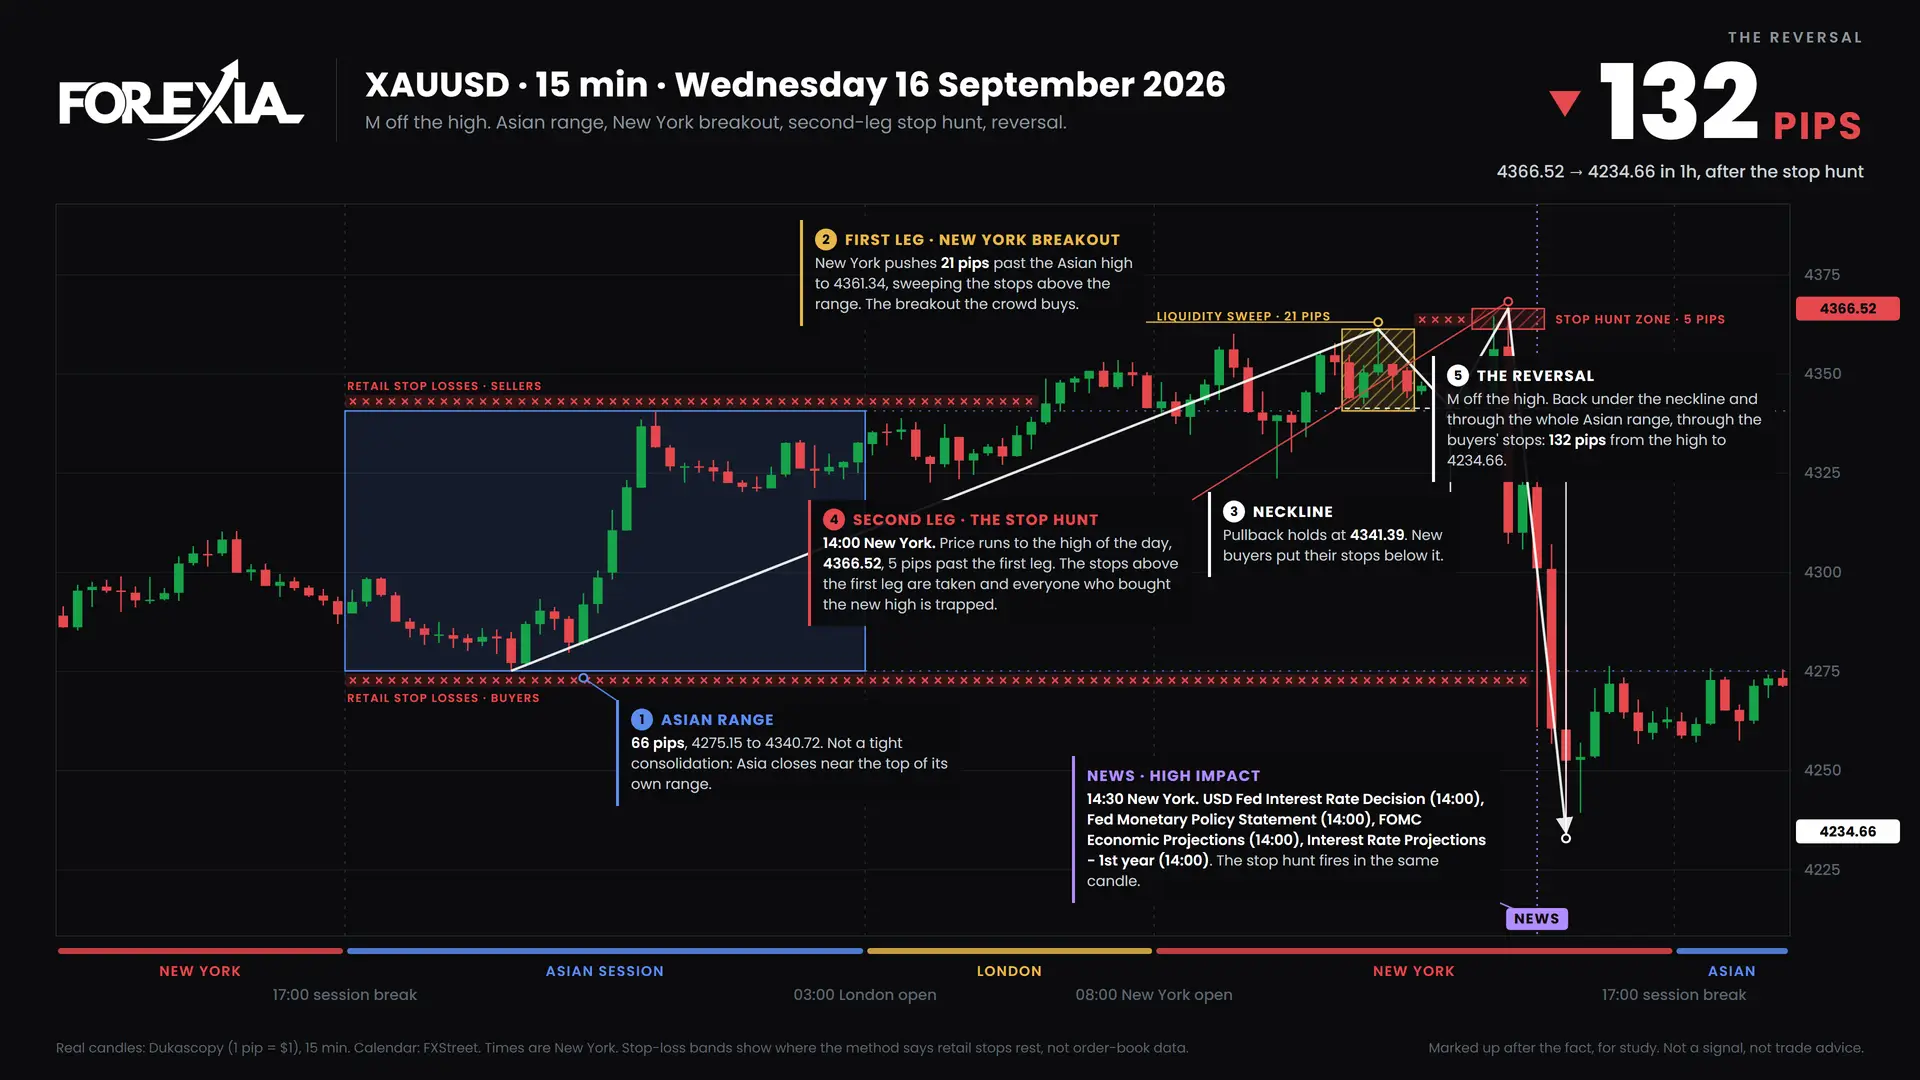
The FOMC stop hunt completed M formations on gold, AUDUSD and NZDUSD in the candle of the Fed decision. Chart markups, 14 September 2026.
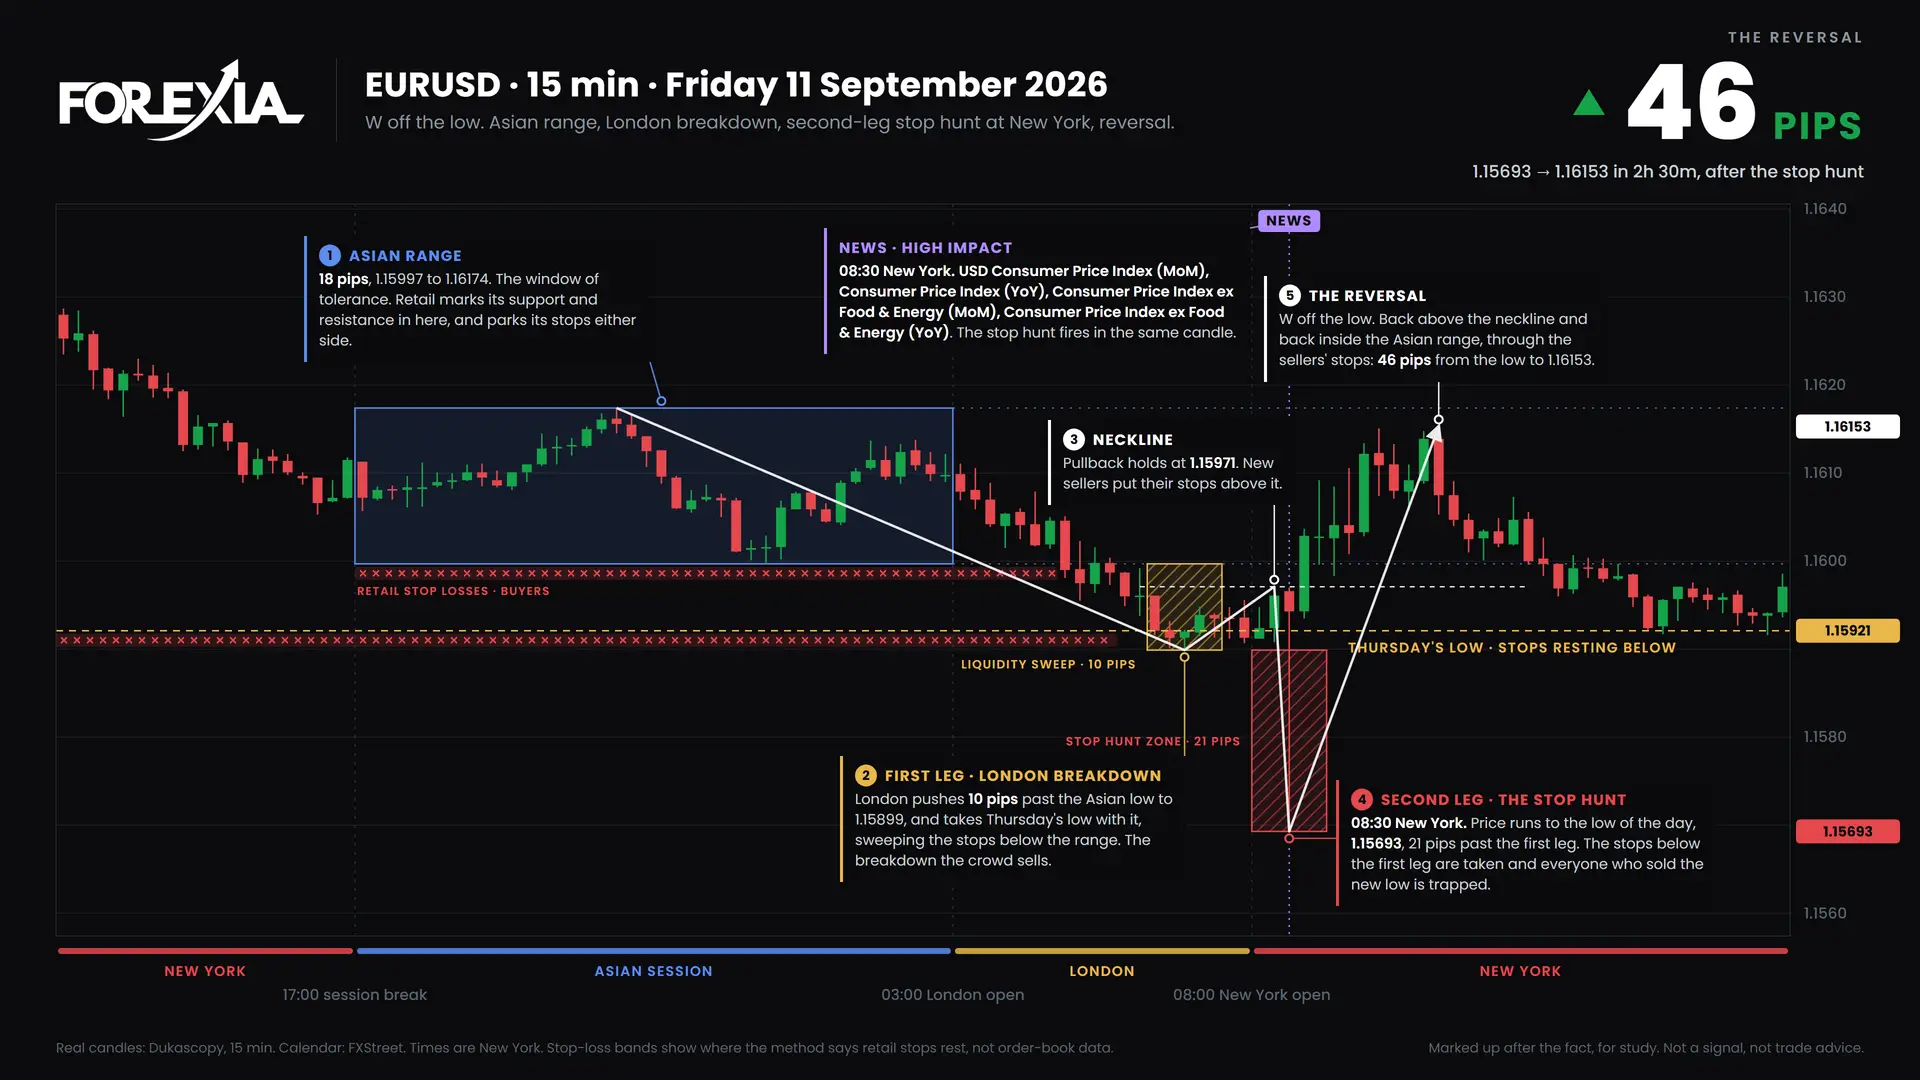
The CPI stop hunt hit EURUSD, GBPUSD and gold in one candle, with an EURUSD W formation at the low of the week. Markups, 7 September 2026.
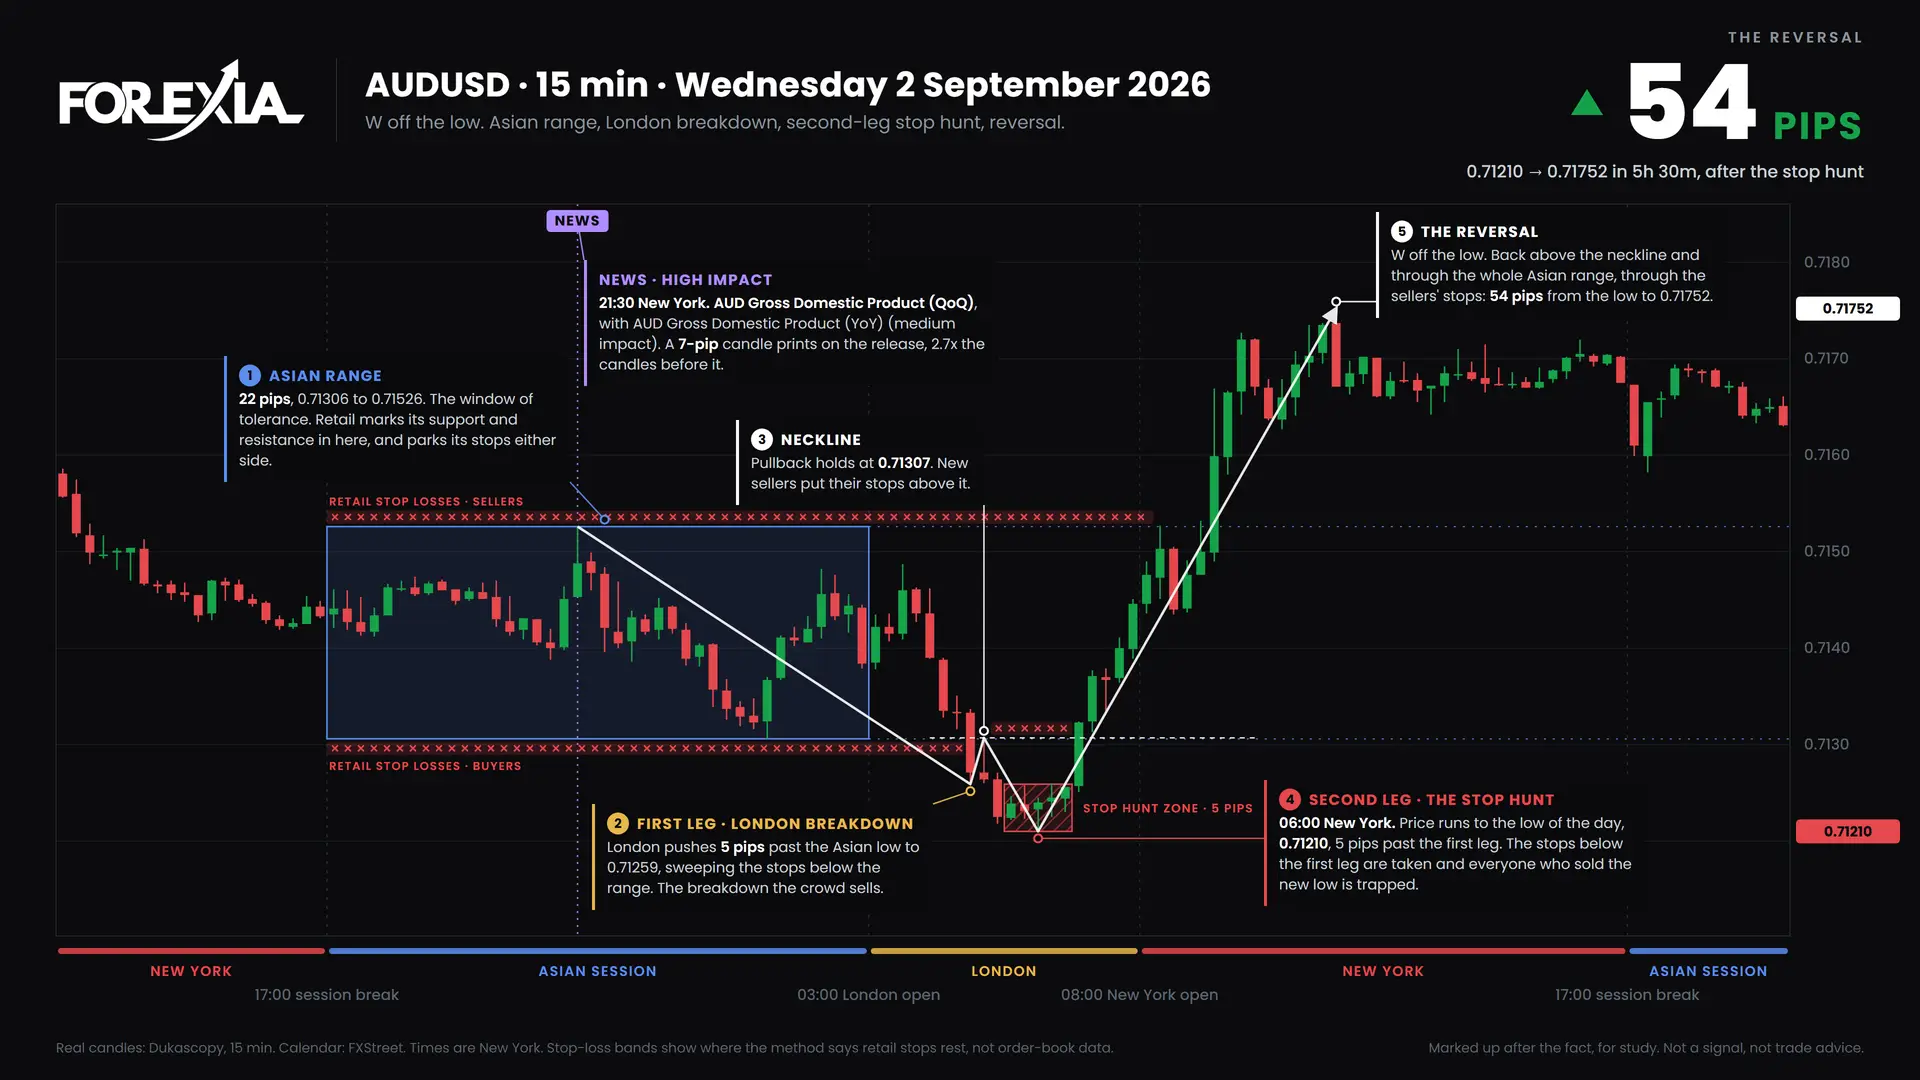
An AUDUSD W formation marked the low of the week as all eight markets turned midweek. Real chart markups for the week of 31 August 2026.
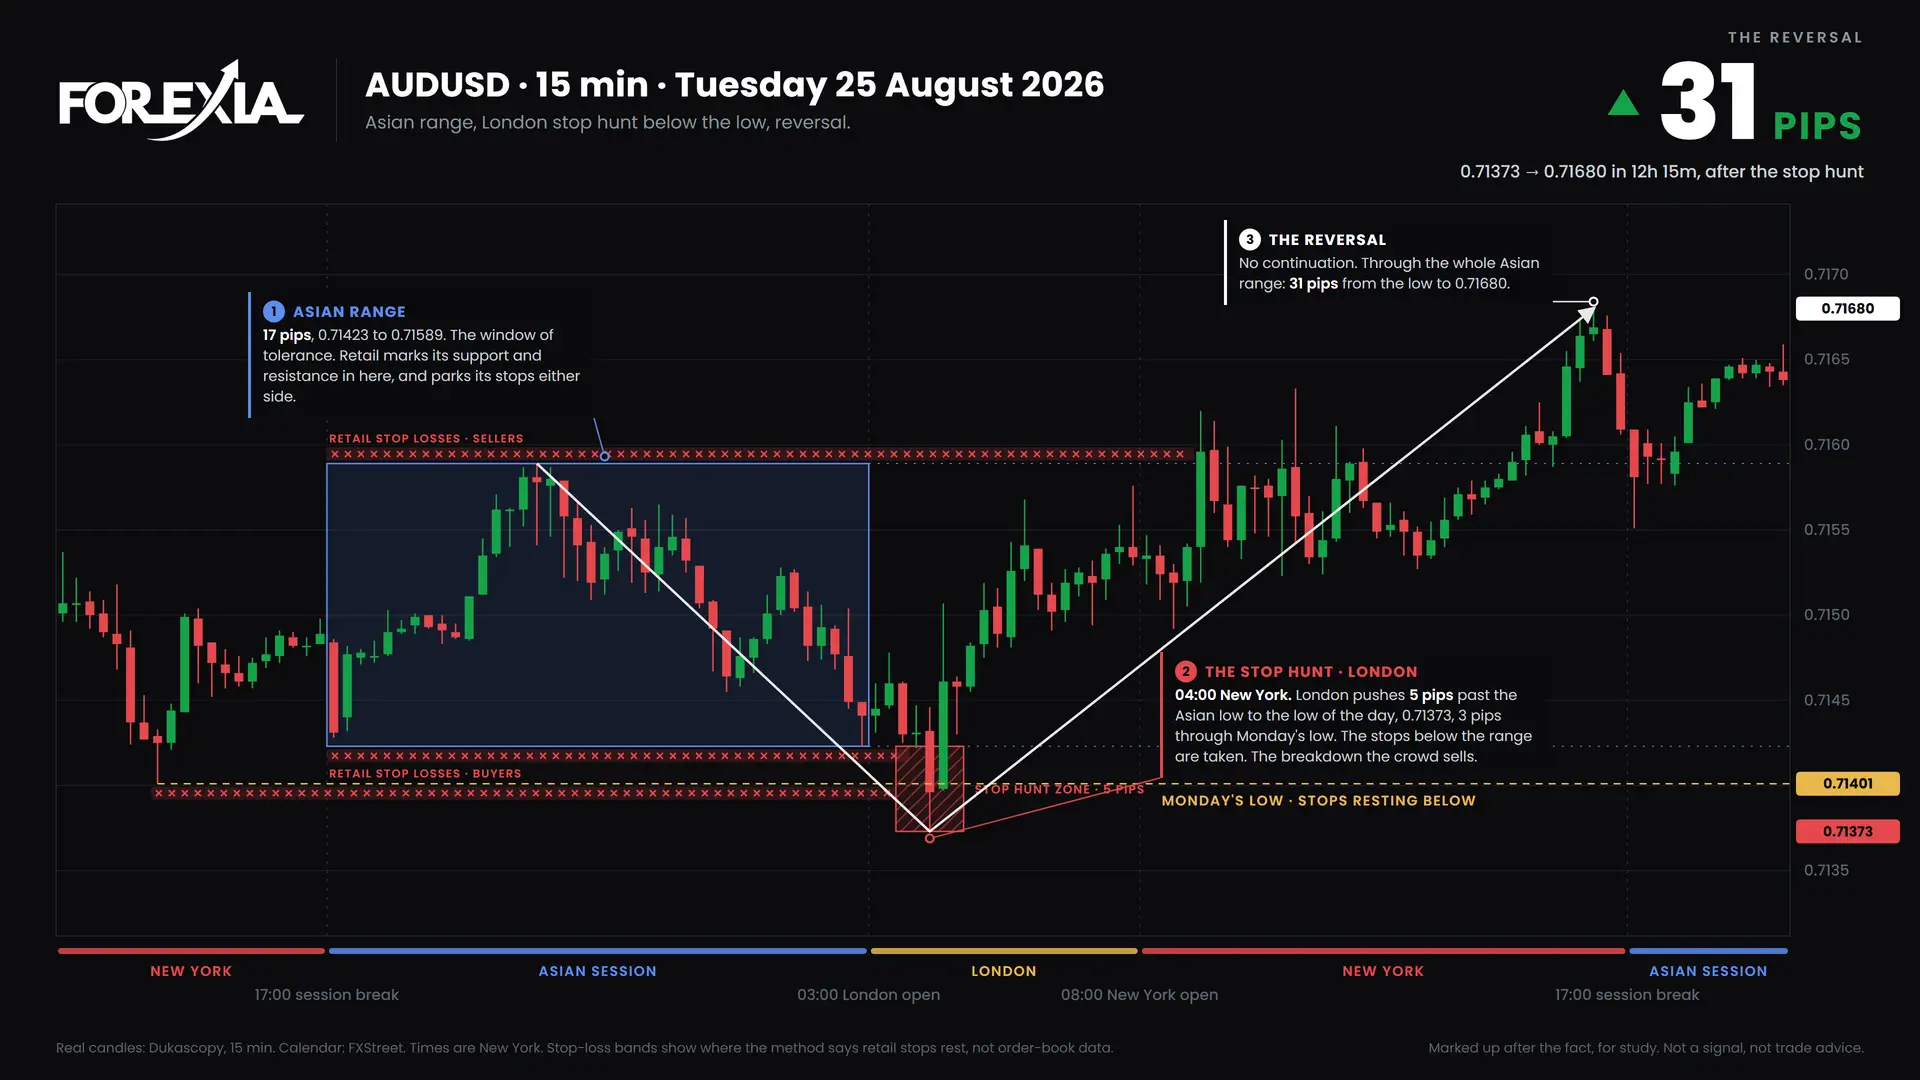
An AUDUSD stop hunt in London set the low of the week, and a second one on Friday set the high. Chart markups, week of 24 August 2026.
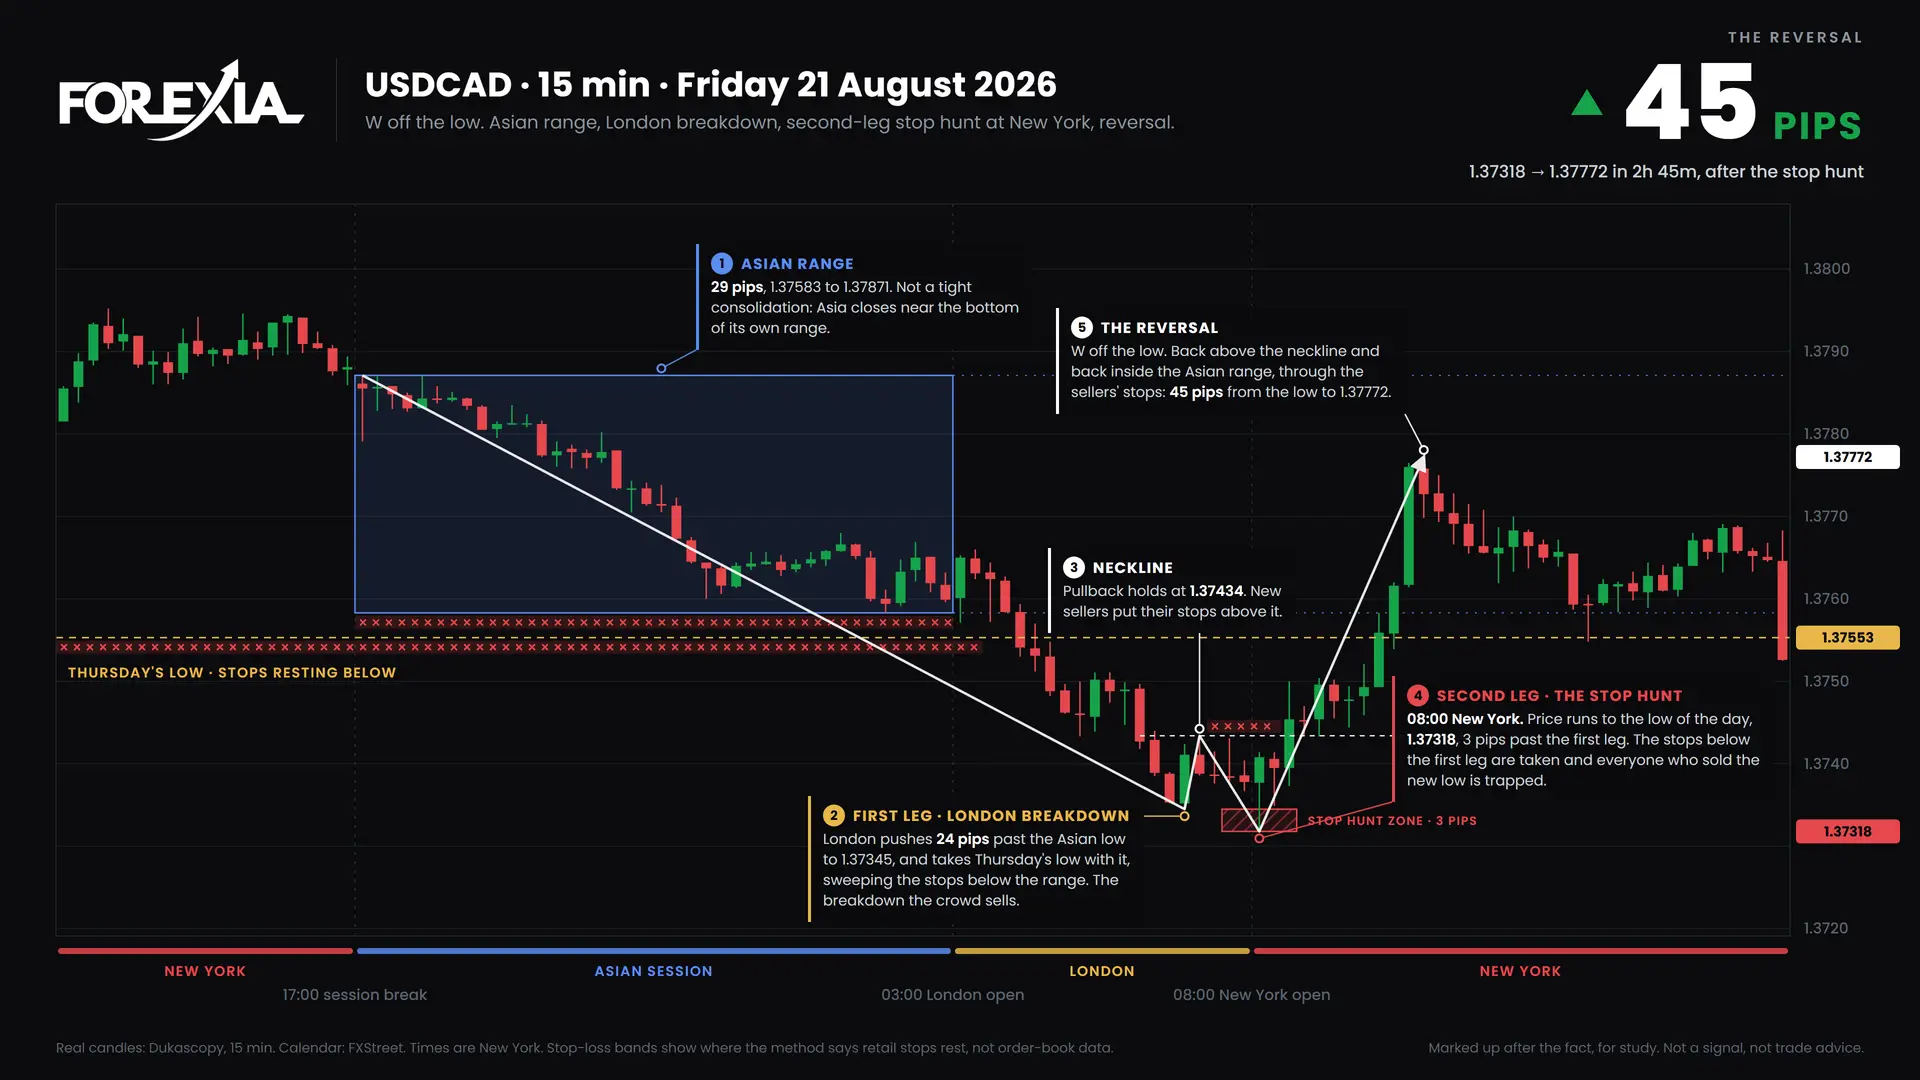
The USDCAD midweek reversal ran 178 pips from Tuesday's high to a Friday W formation at the low. Chart markups, week of 17 August 2026.
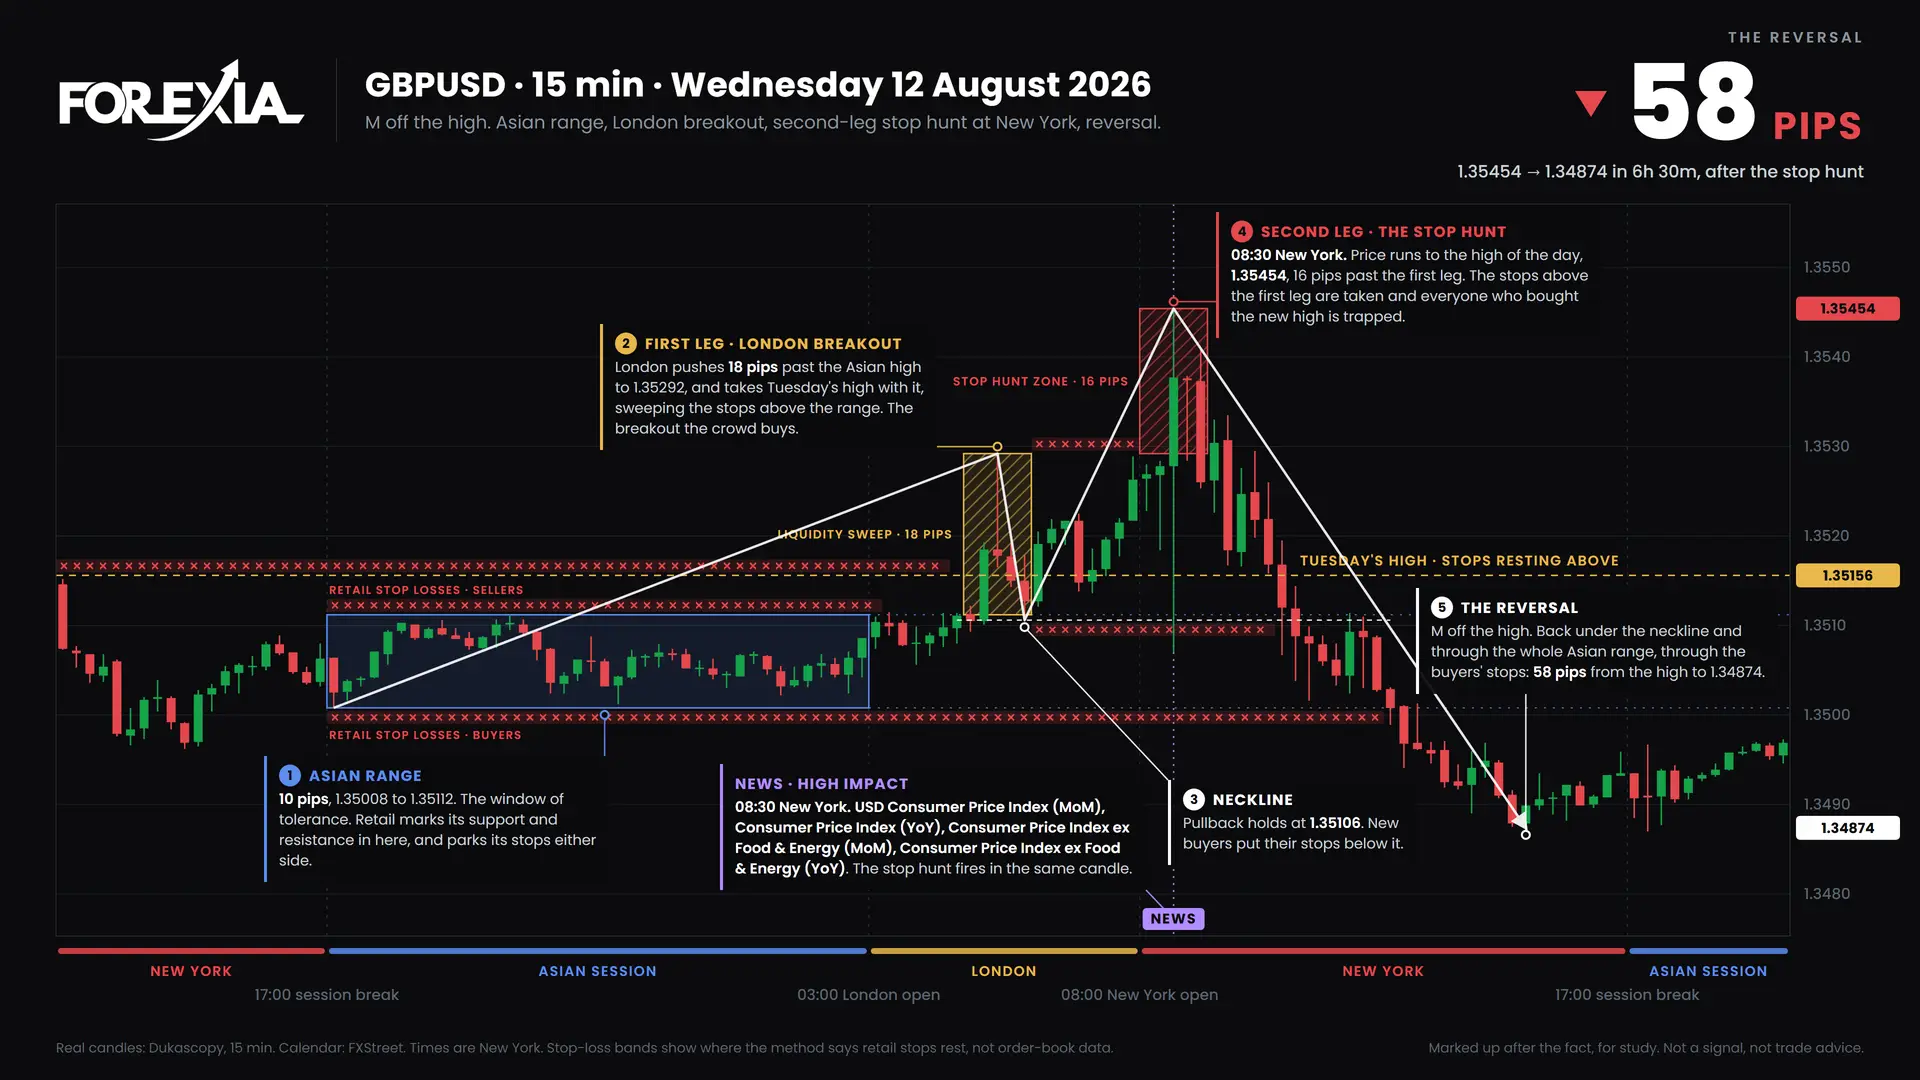
A GBPUSD M formation on US CPI scored 7 of 8 and fell 58 pips, yet the high did not survive the week. Chart markups, 10 August 2026.
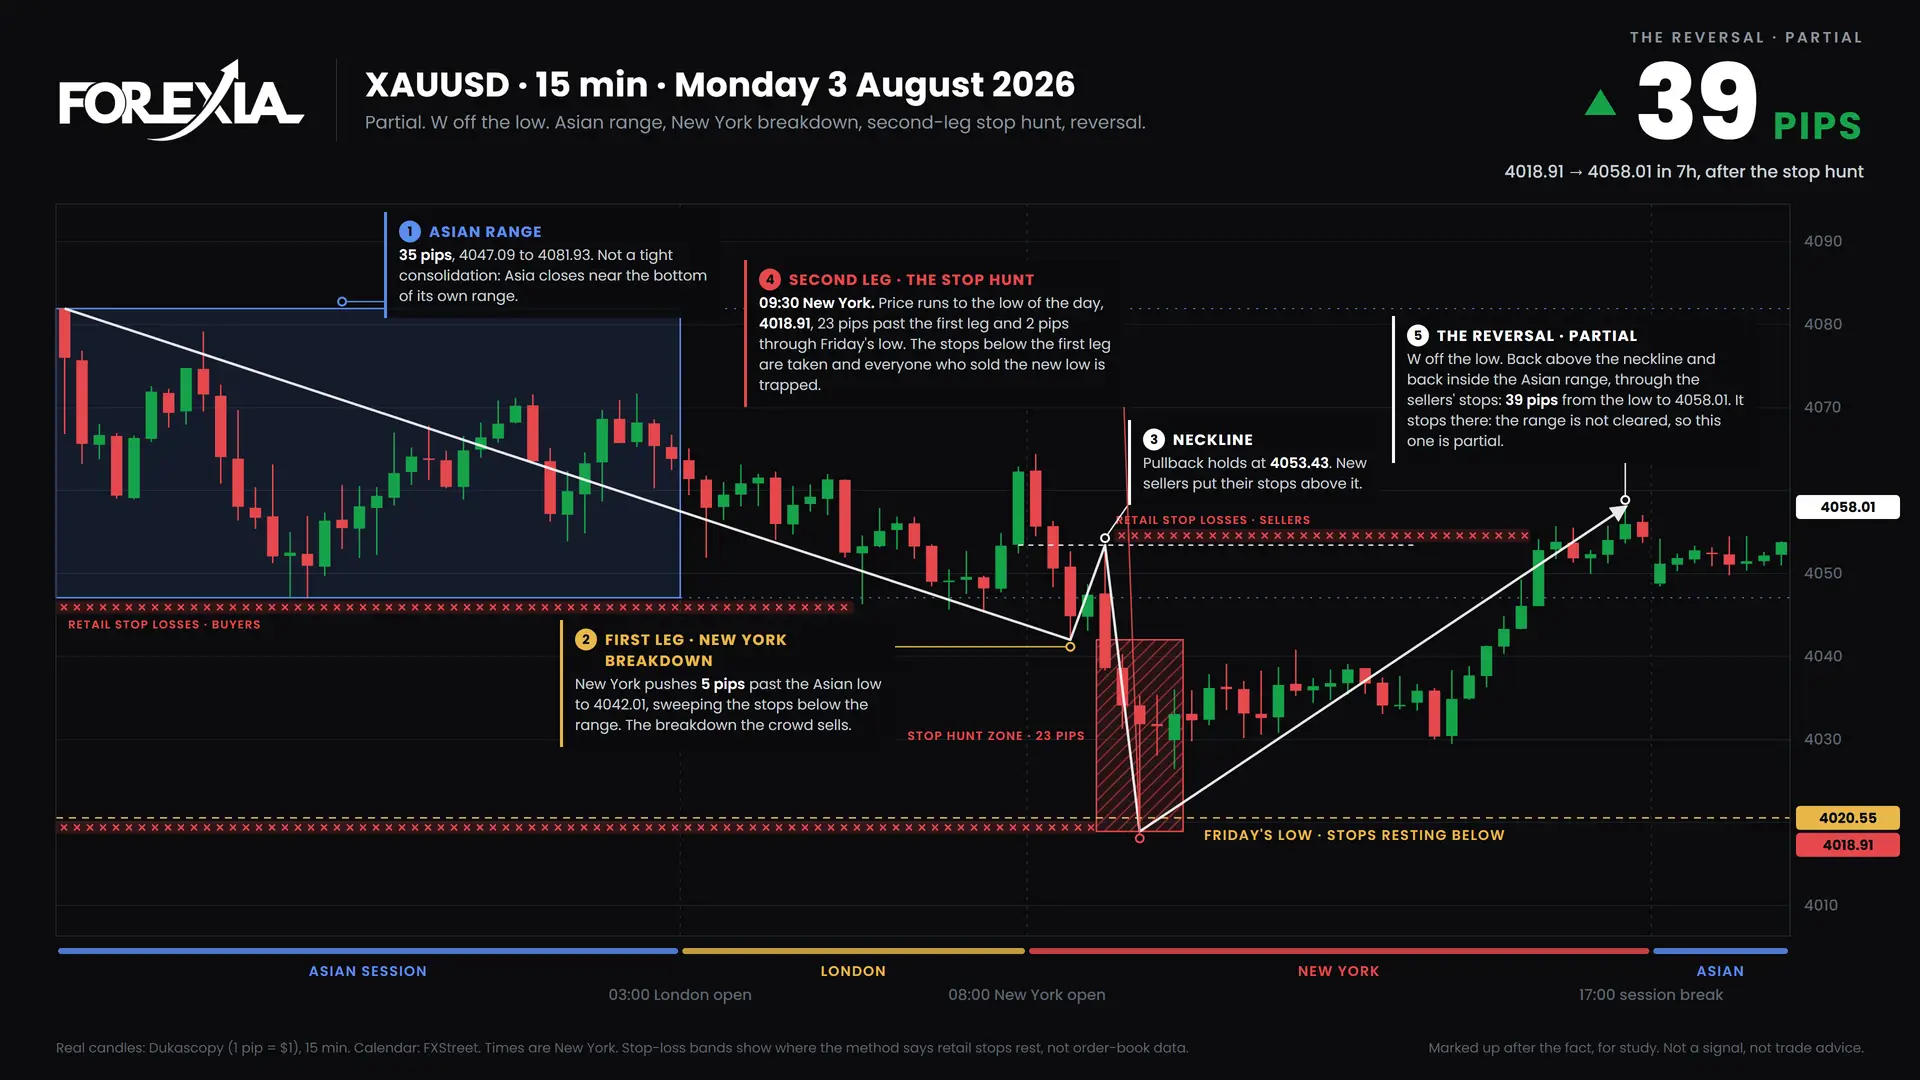
A gold W formation on Monday paid 39 pips that day and 353 on the week from the same low. Real chart markups, week of 3 August 2026.
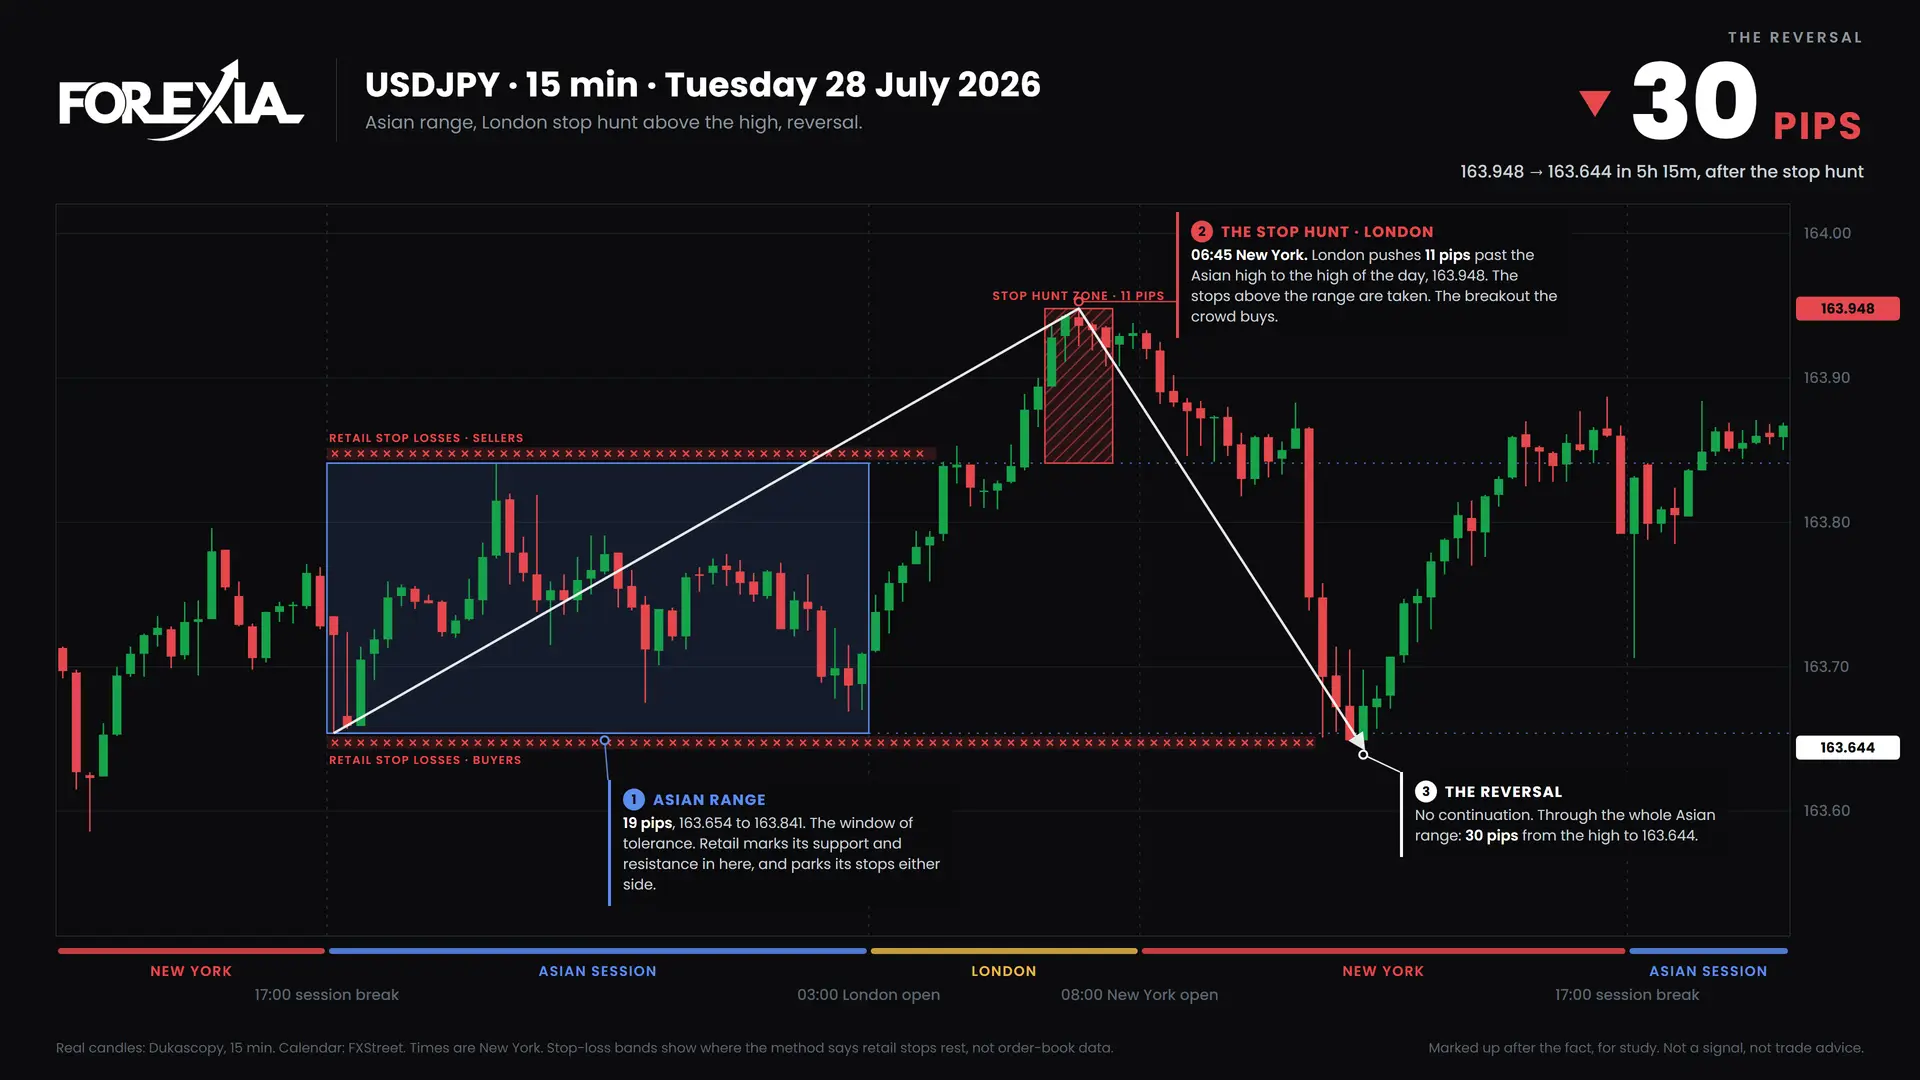
The USDJPY midweek reversal fell 675 pips from a Tuesday stop hunt, the largest move in six months of chart markups. Week of 27 July 2026.
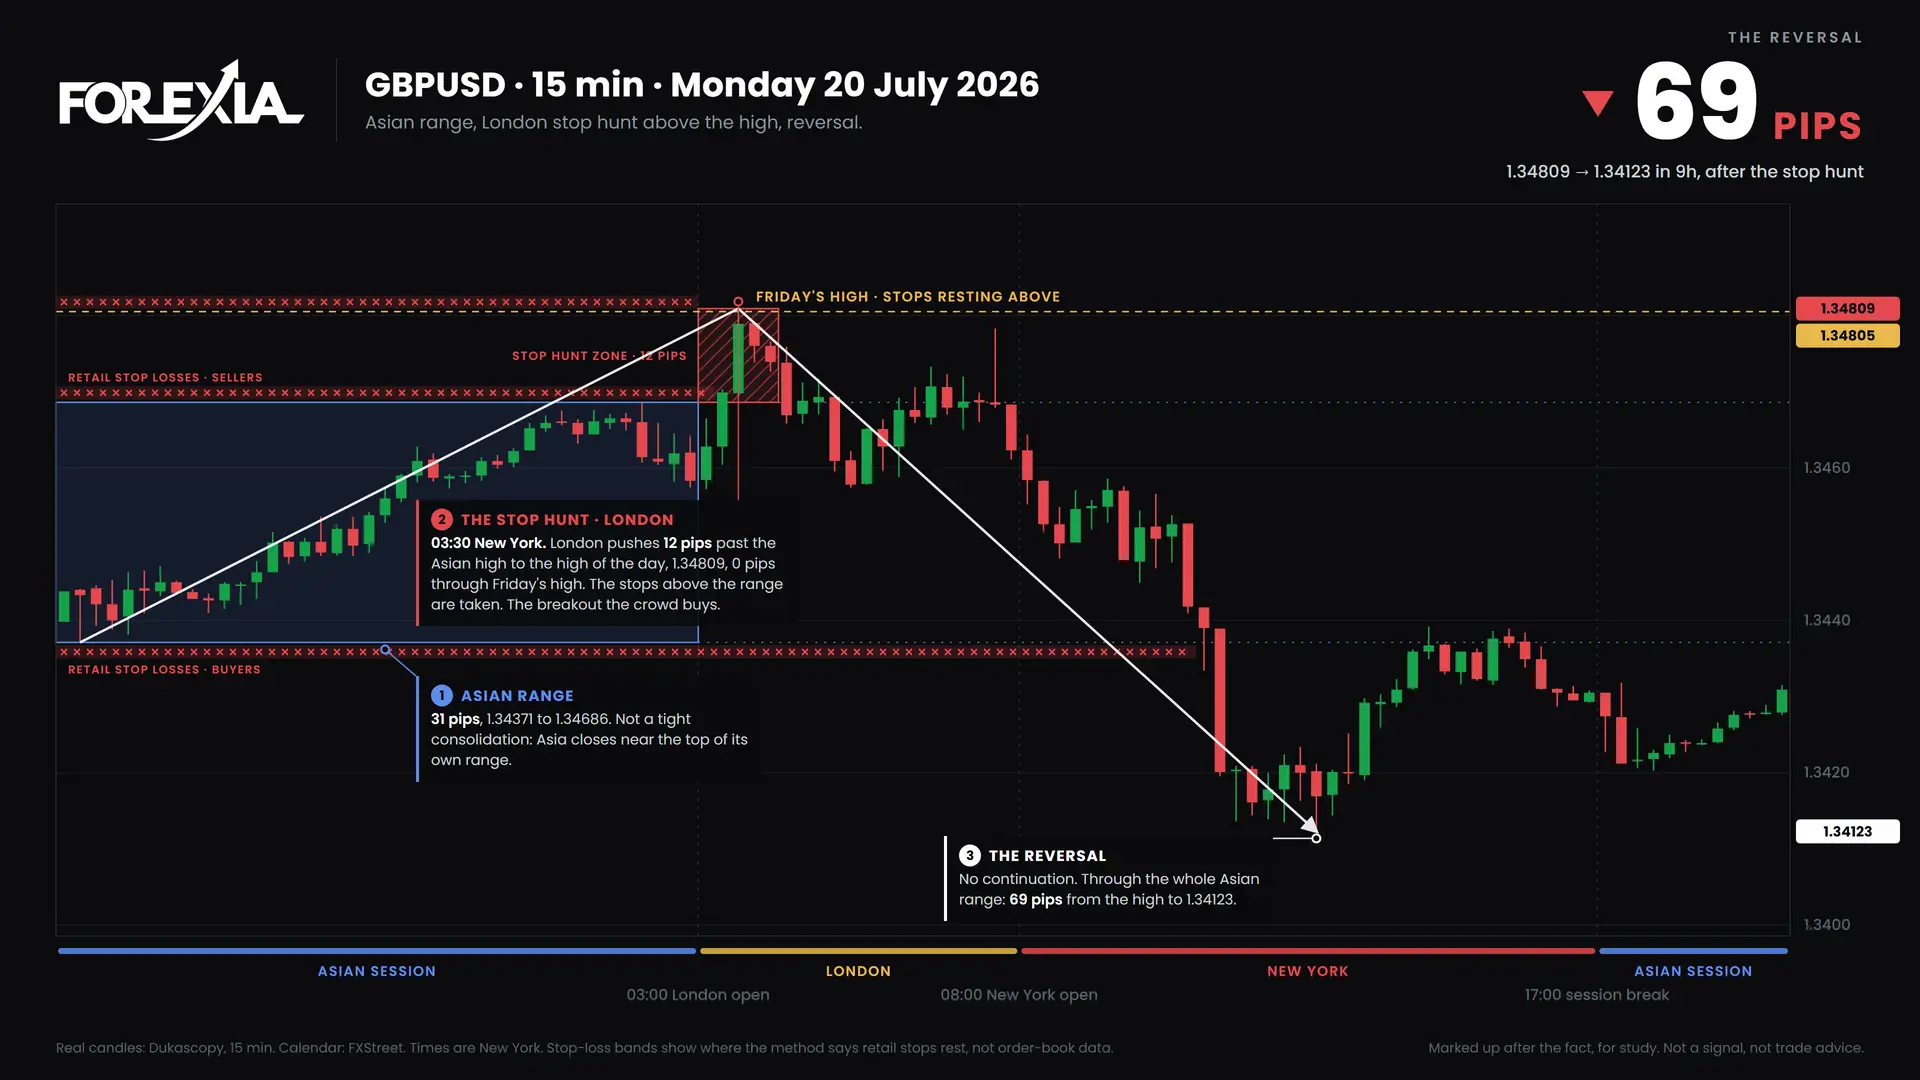
A GBPUSD stop hunt at Monday's London open set the high of the week, and price fell 185 pips. Real chart markups, week of 20 July 2026.
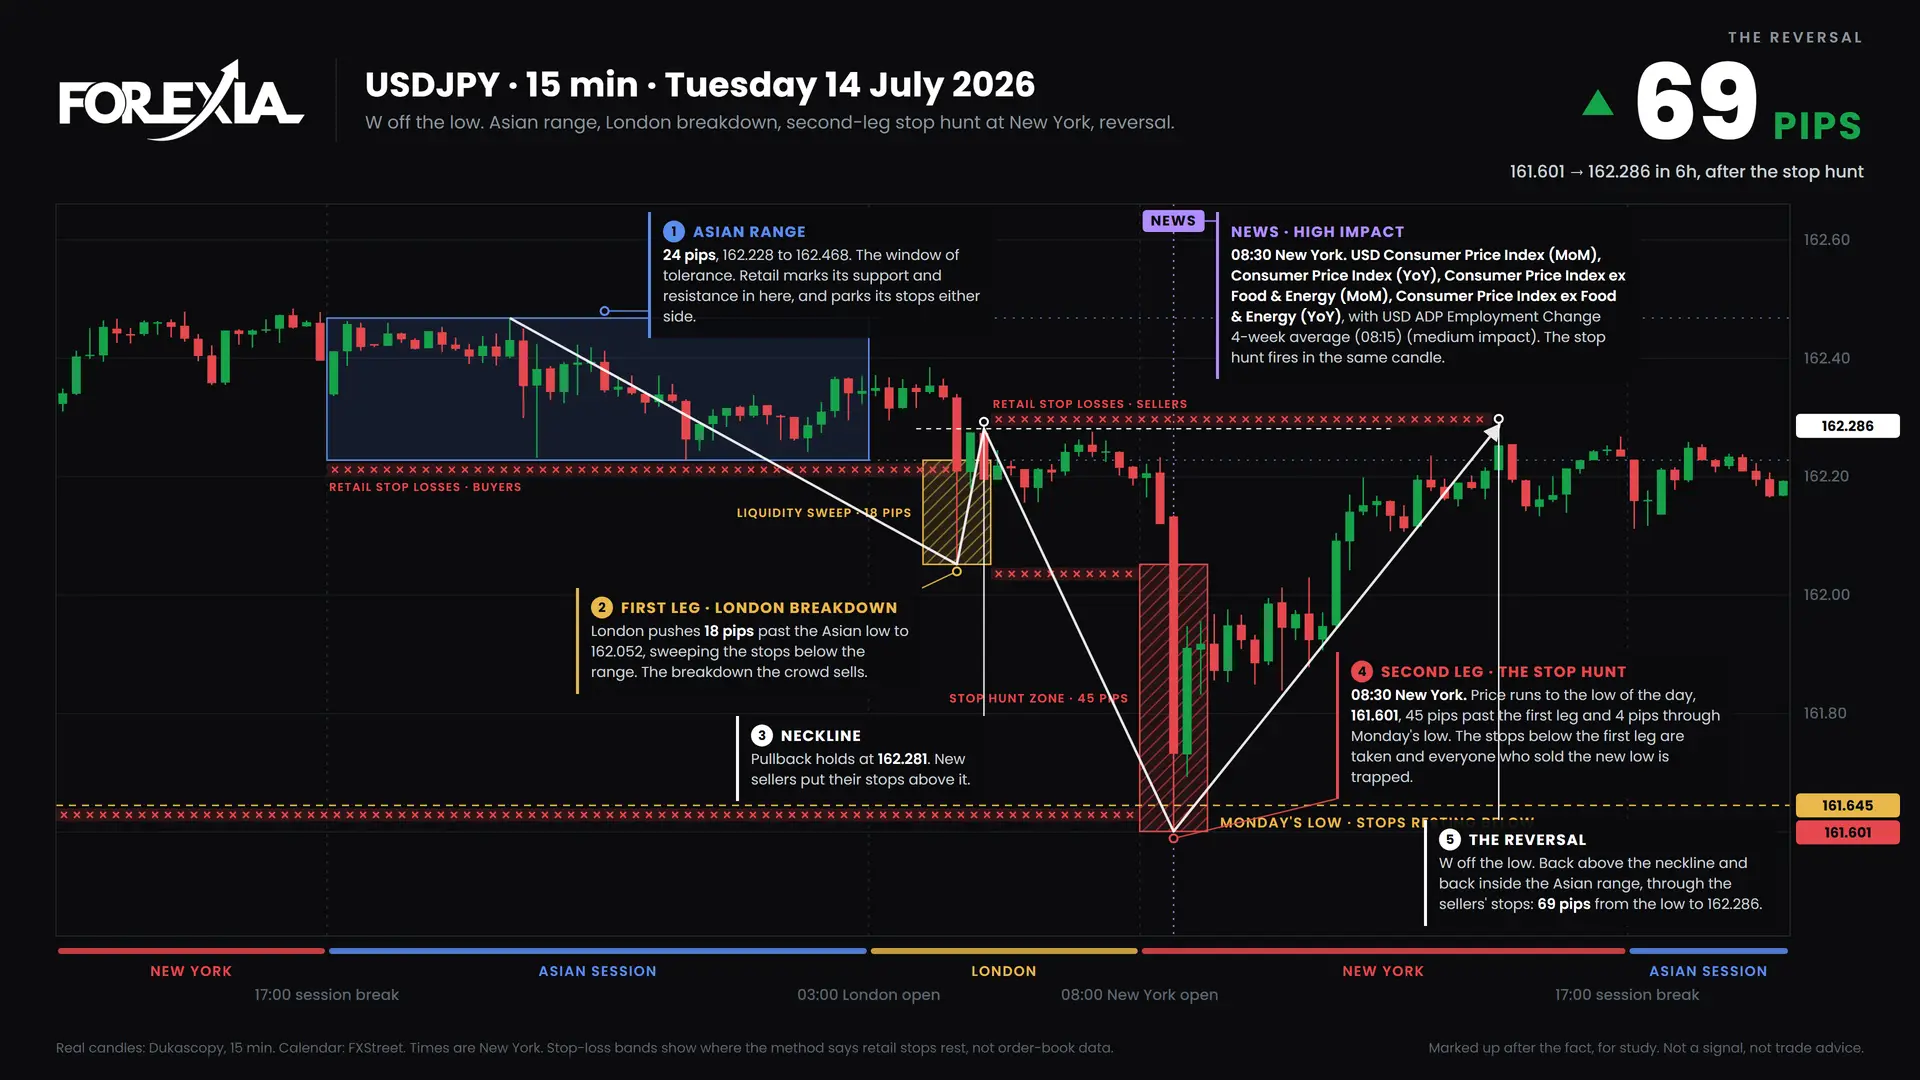
A USDJPY W formation hunted stops on US CPI, scored 7 of 8 and became the low of the week. Real chart markups, week of 13 July 2026.
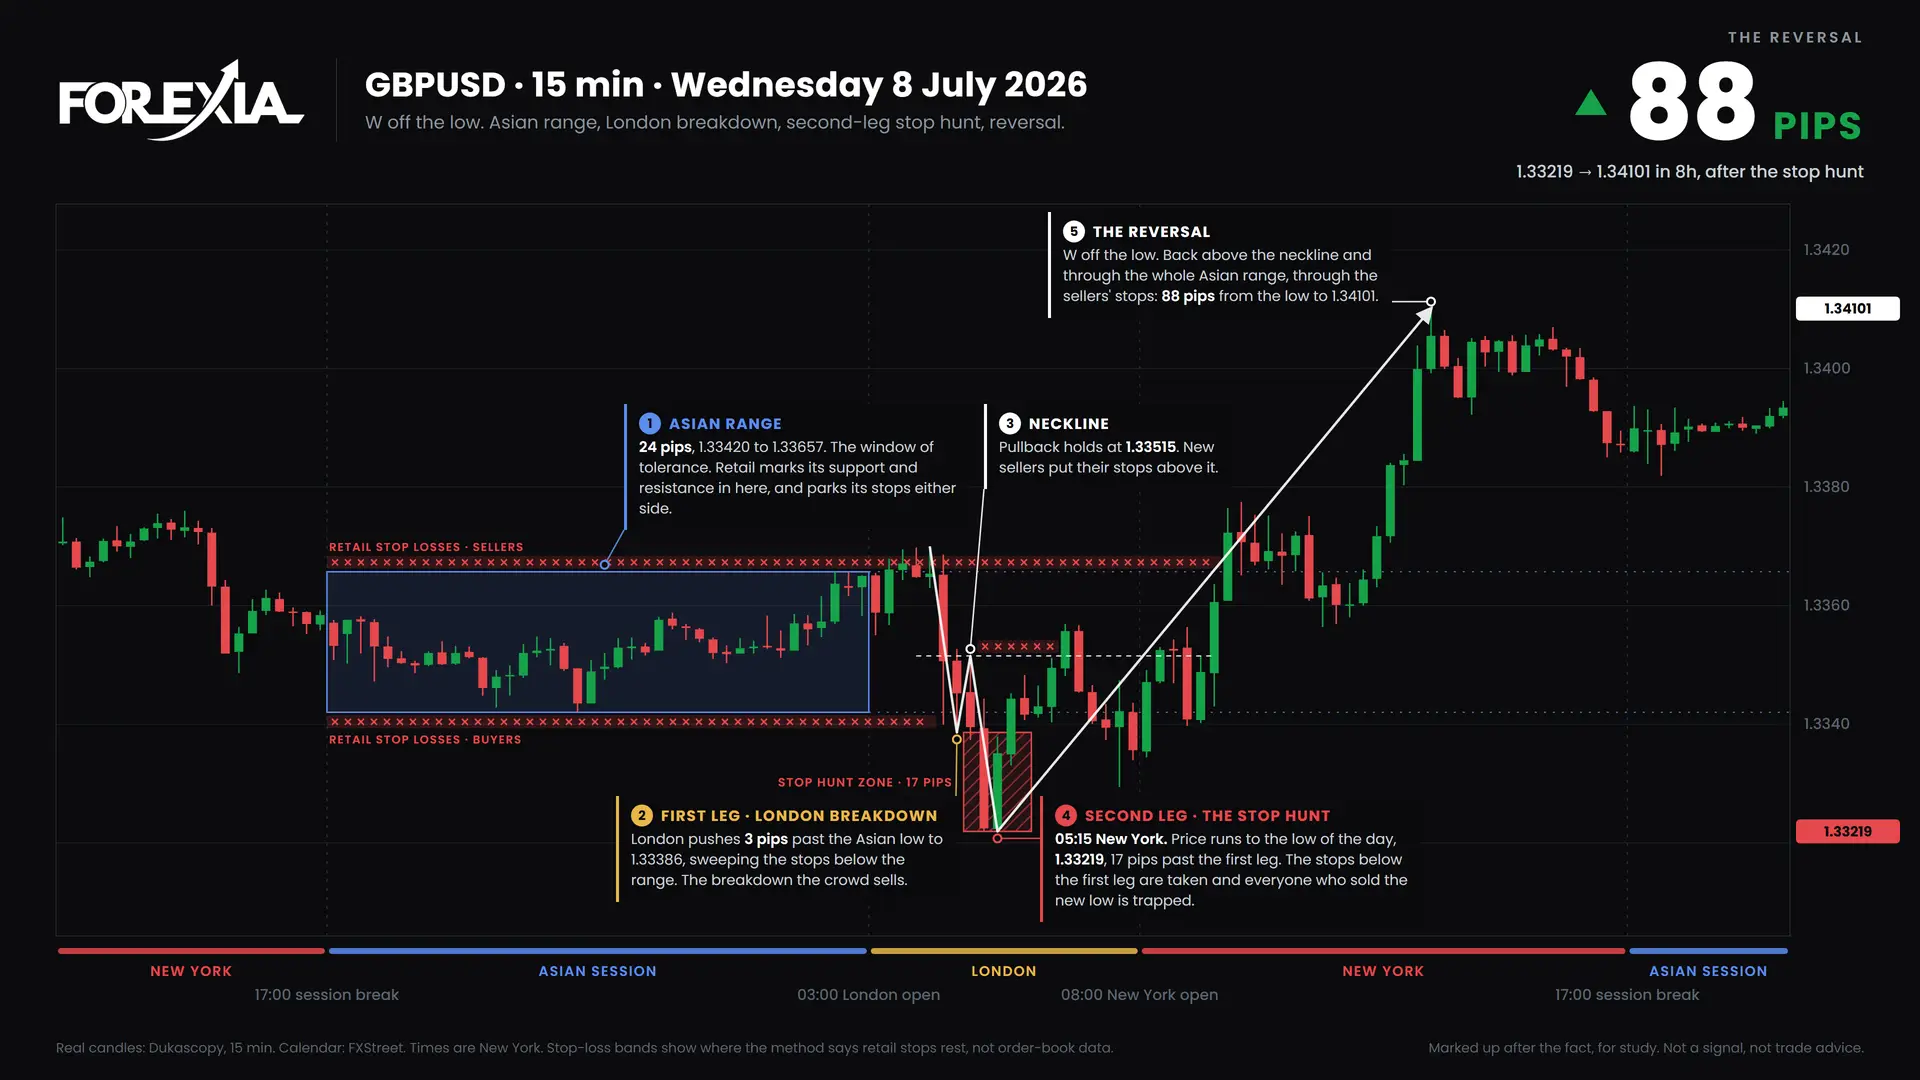
The GBPUSD midweek reversal began with a London W formation at the low of the week and ran 130 pips. Chart markups, week of 6 July 2026.
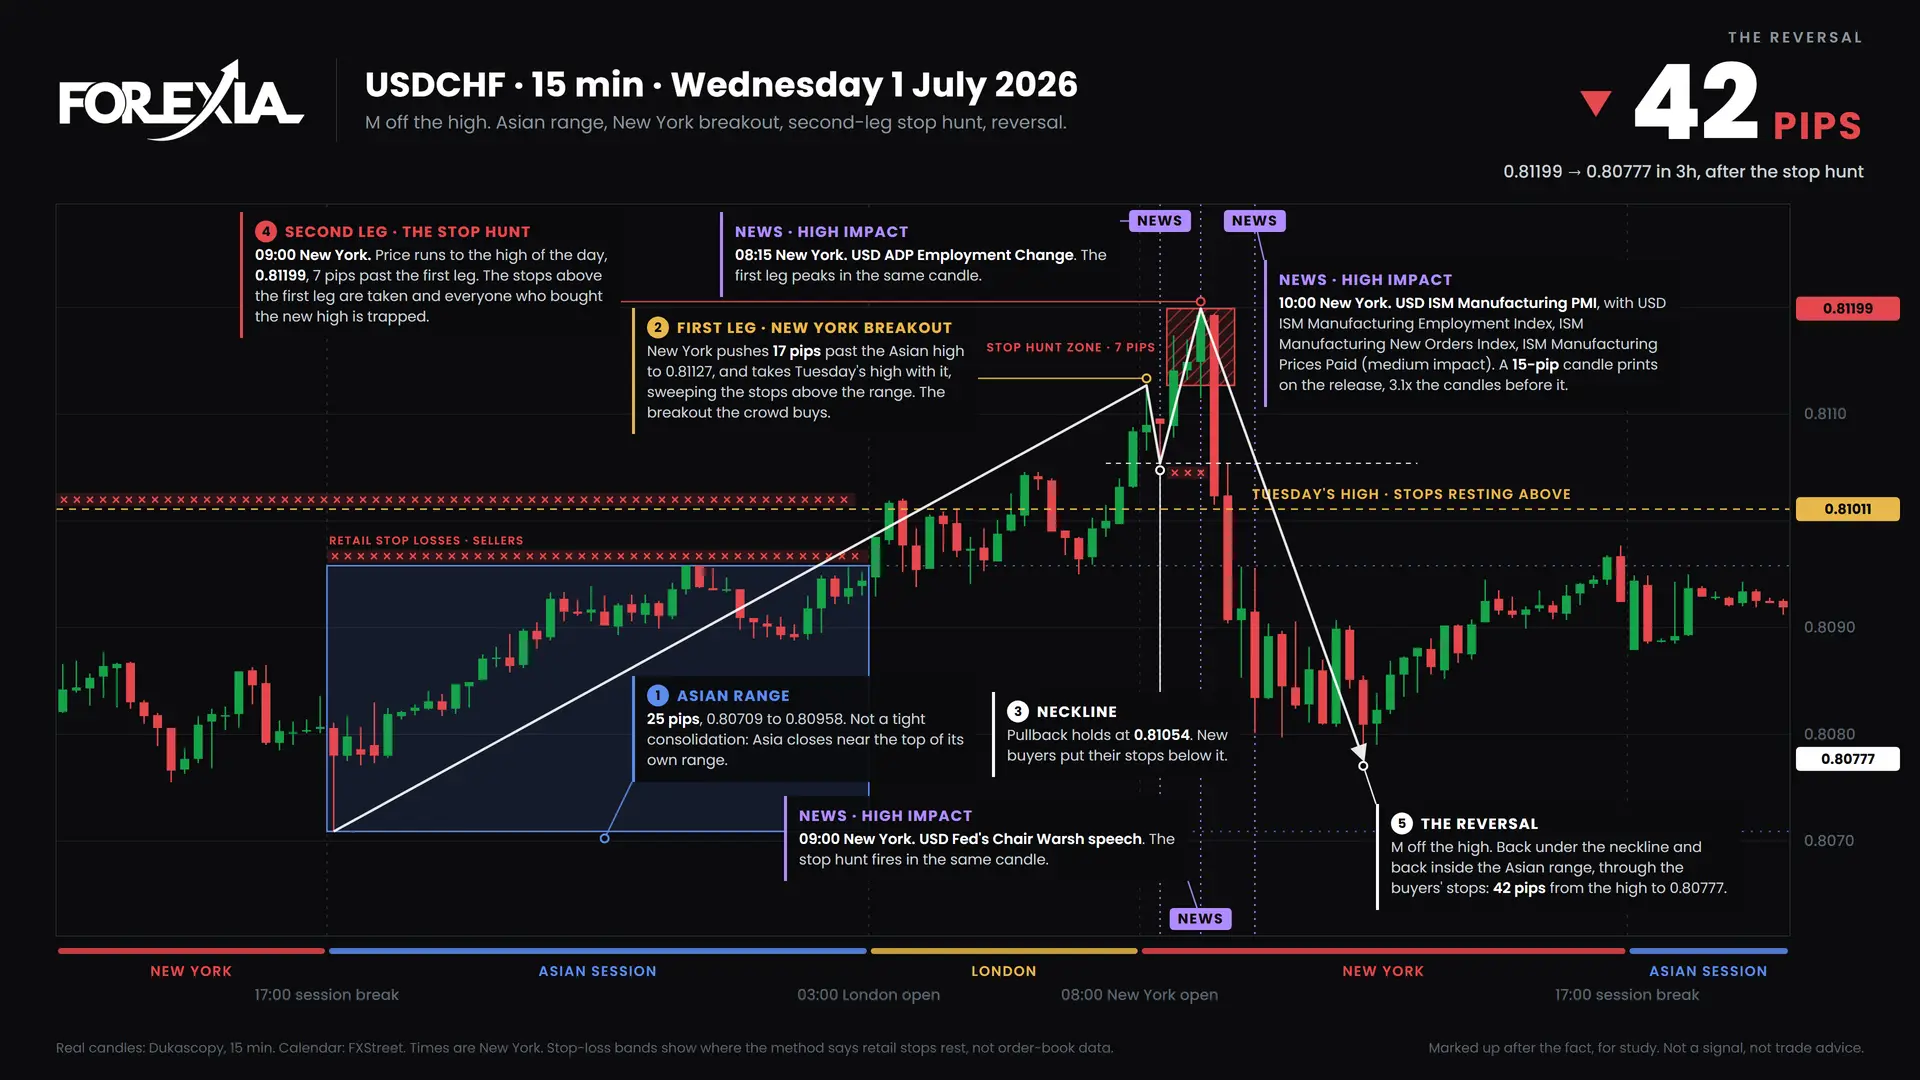
A USDCHF M formation made the high of the week at the New York open and fell 111 pips, as five pairs turned at once. Markups, 29 June 2026.
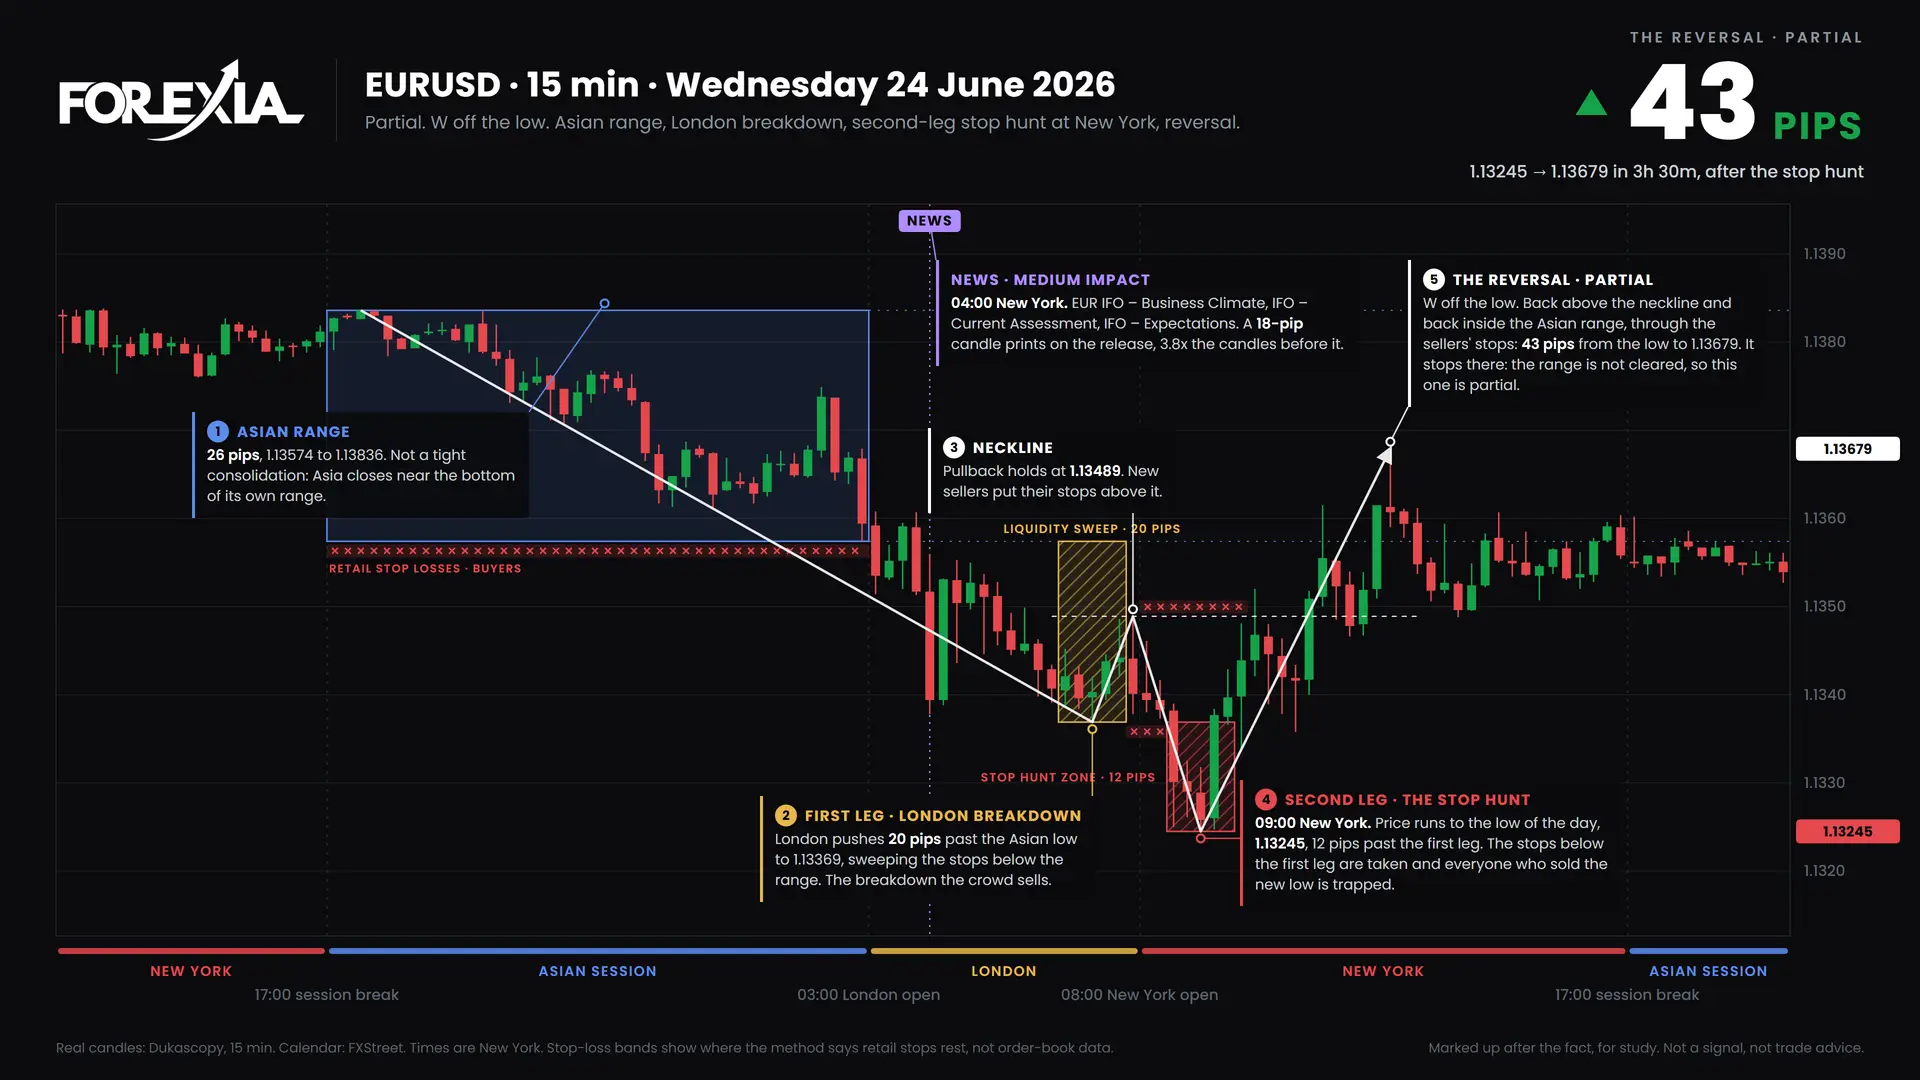
The EURUSD midweek reversal turned on a Wednesday W formation and climbed 109 pips, with two honest flaws. Chart markups, 22 June 2026.
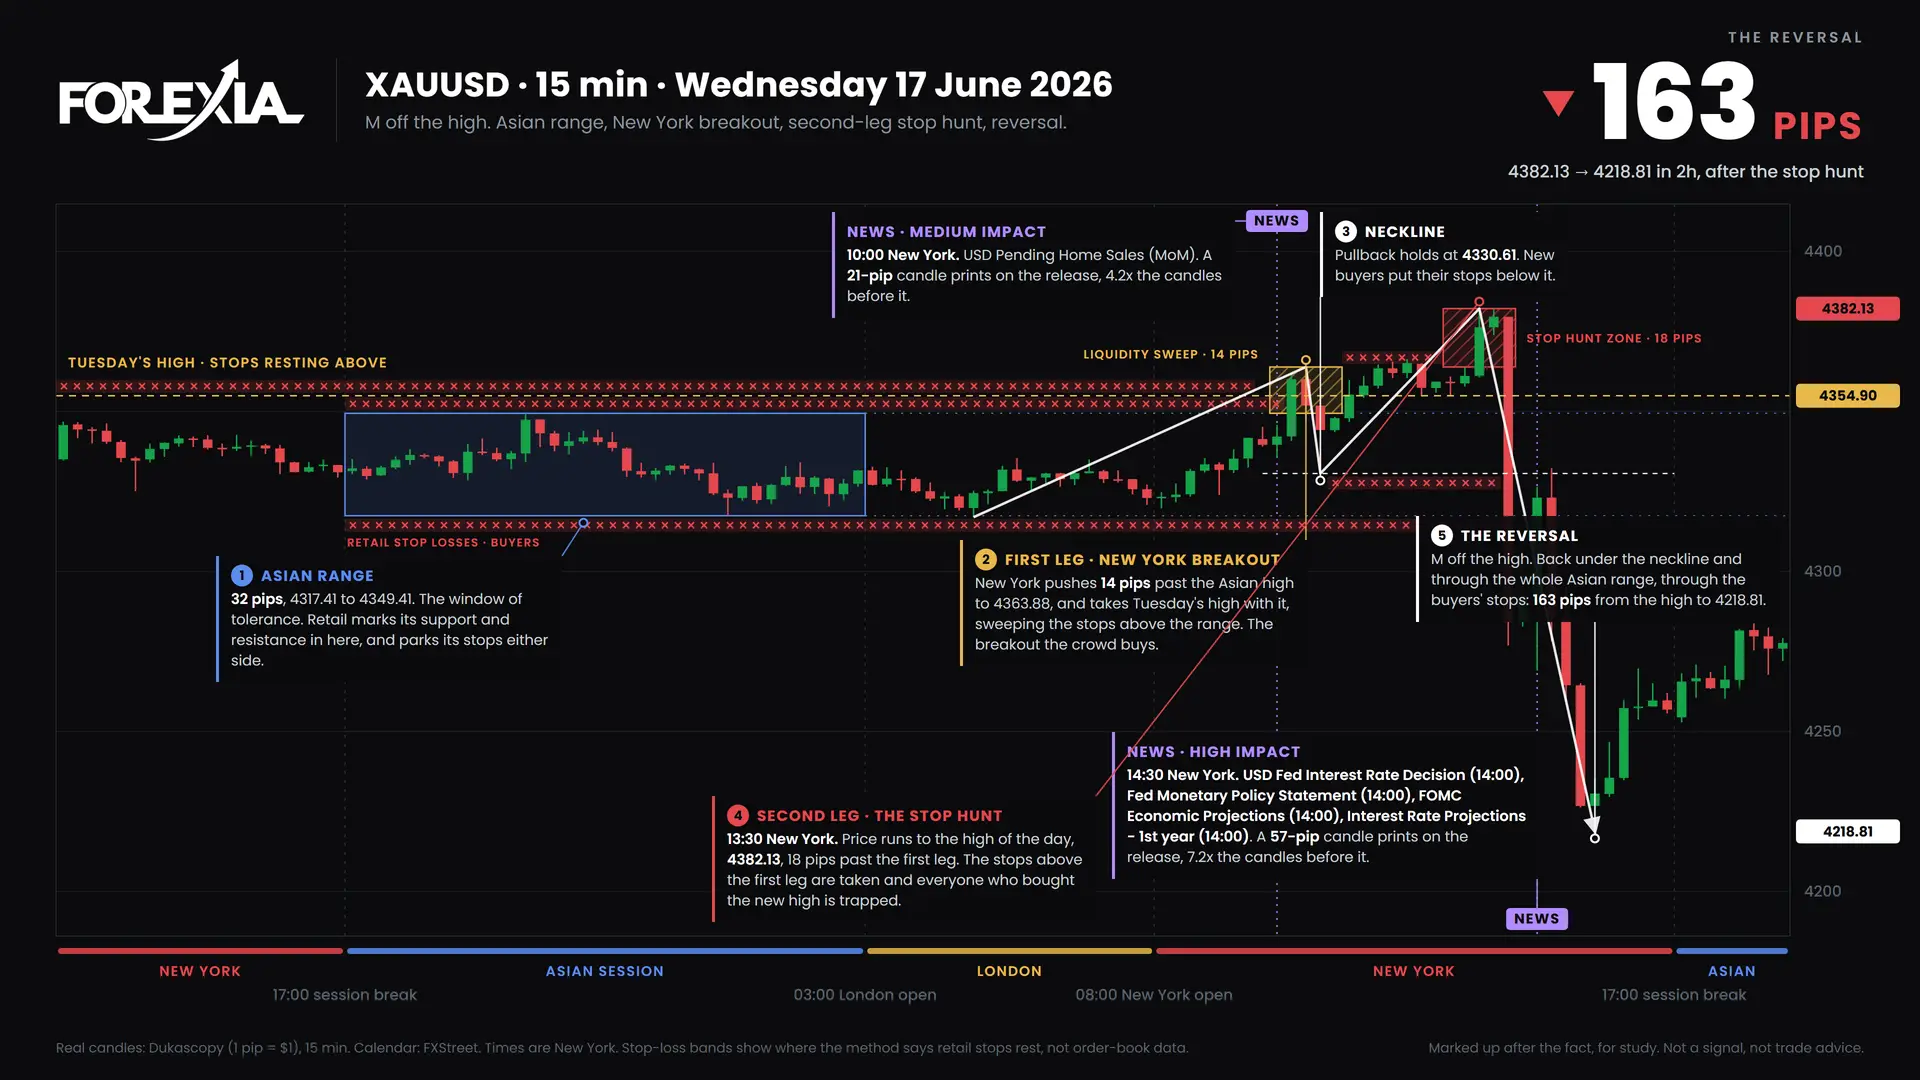
A gold M formation topped half an hour before the Fed decision and fell 163 pips that day. Real chart markups for the week of 15 June 2026.
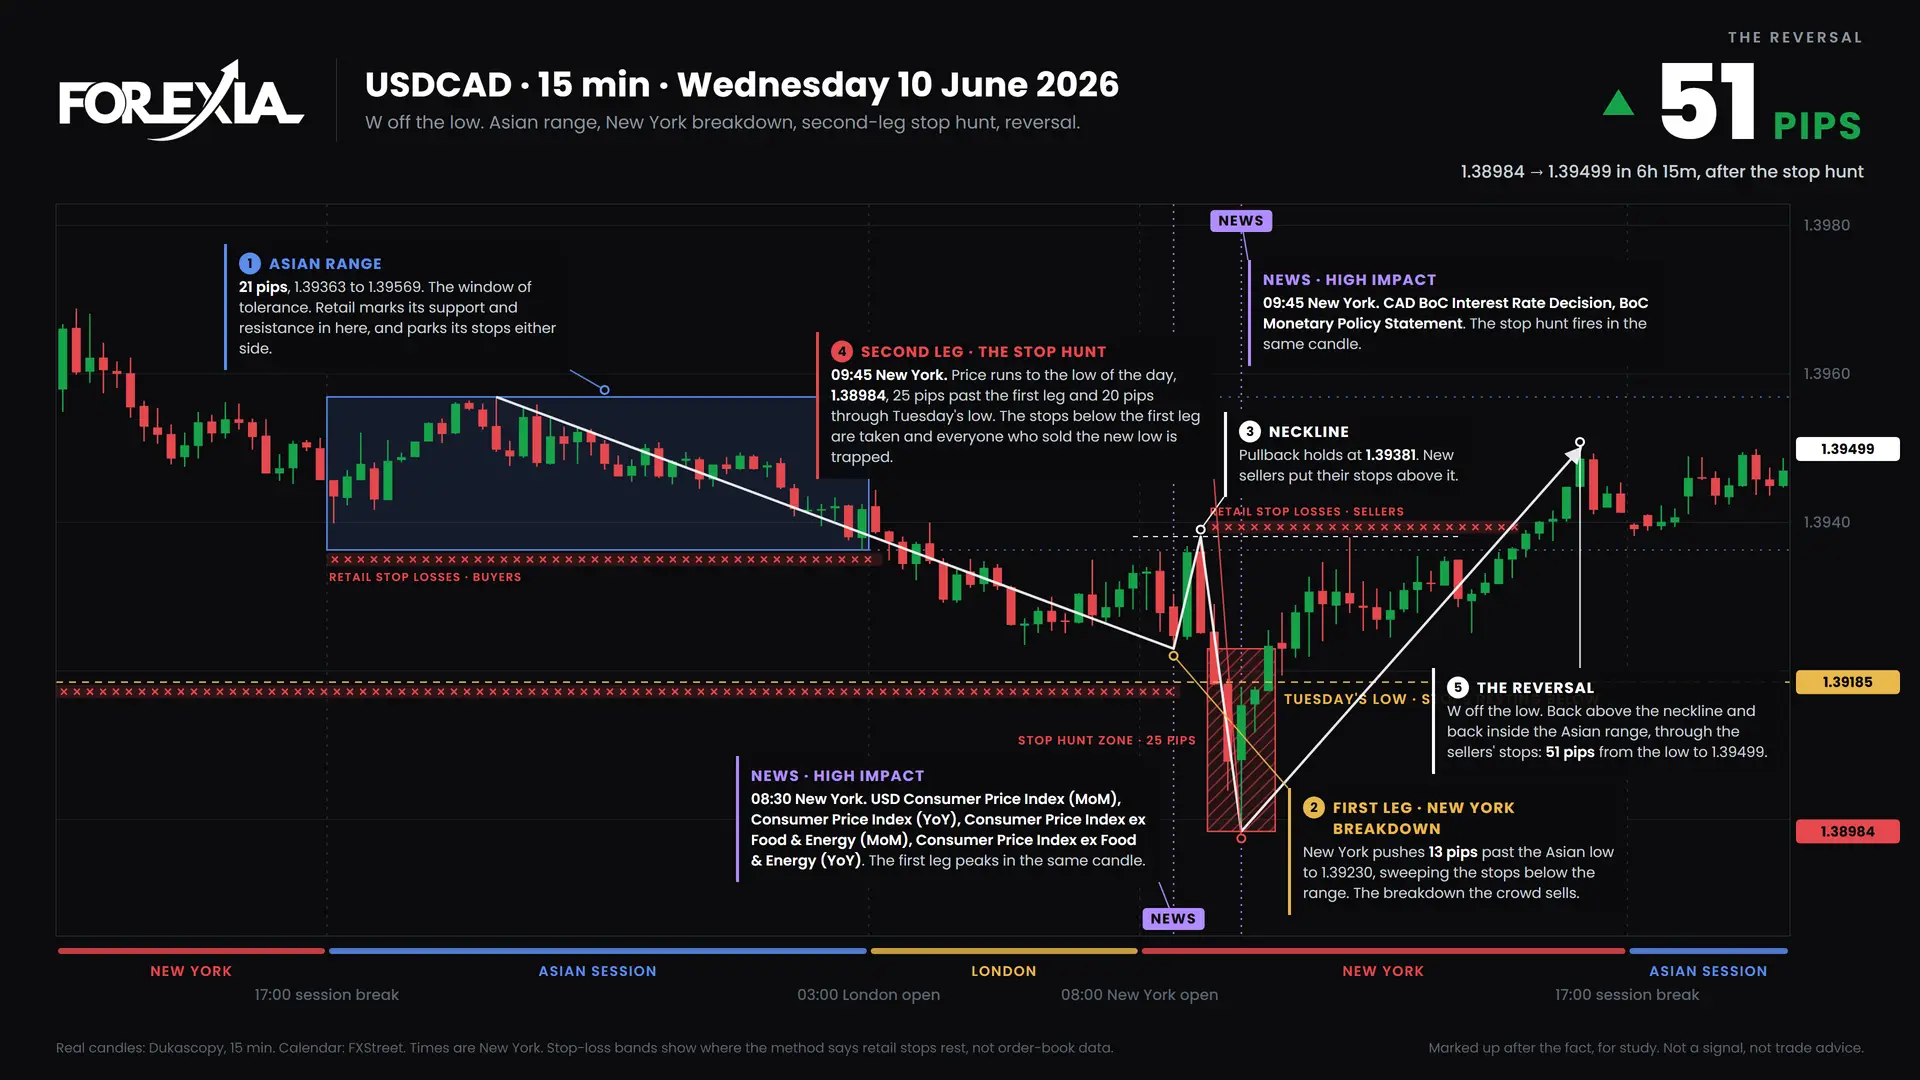
The only 8 of 8: a USDCAD W formation on US CPI and the BoC decision that became the low of the week. Chart markups, 8 June 2026.
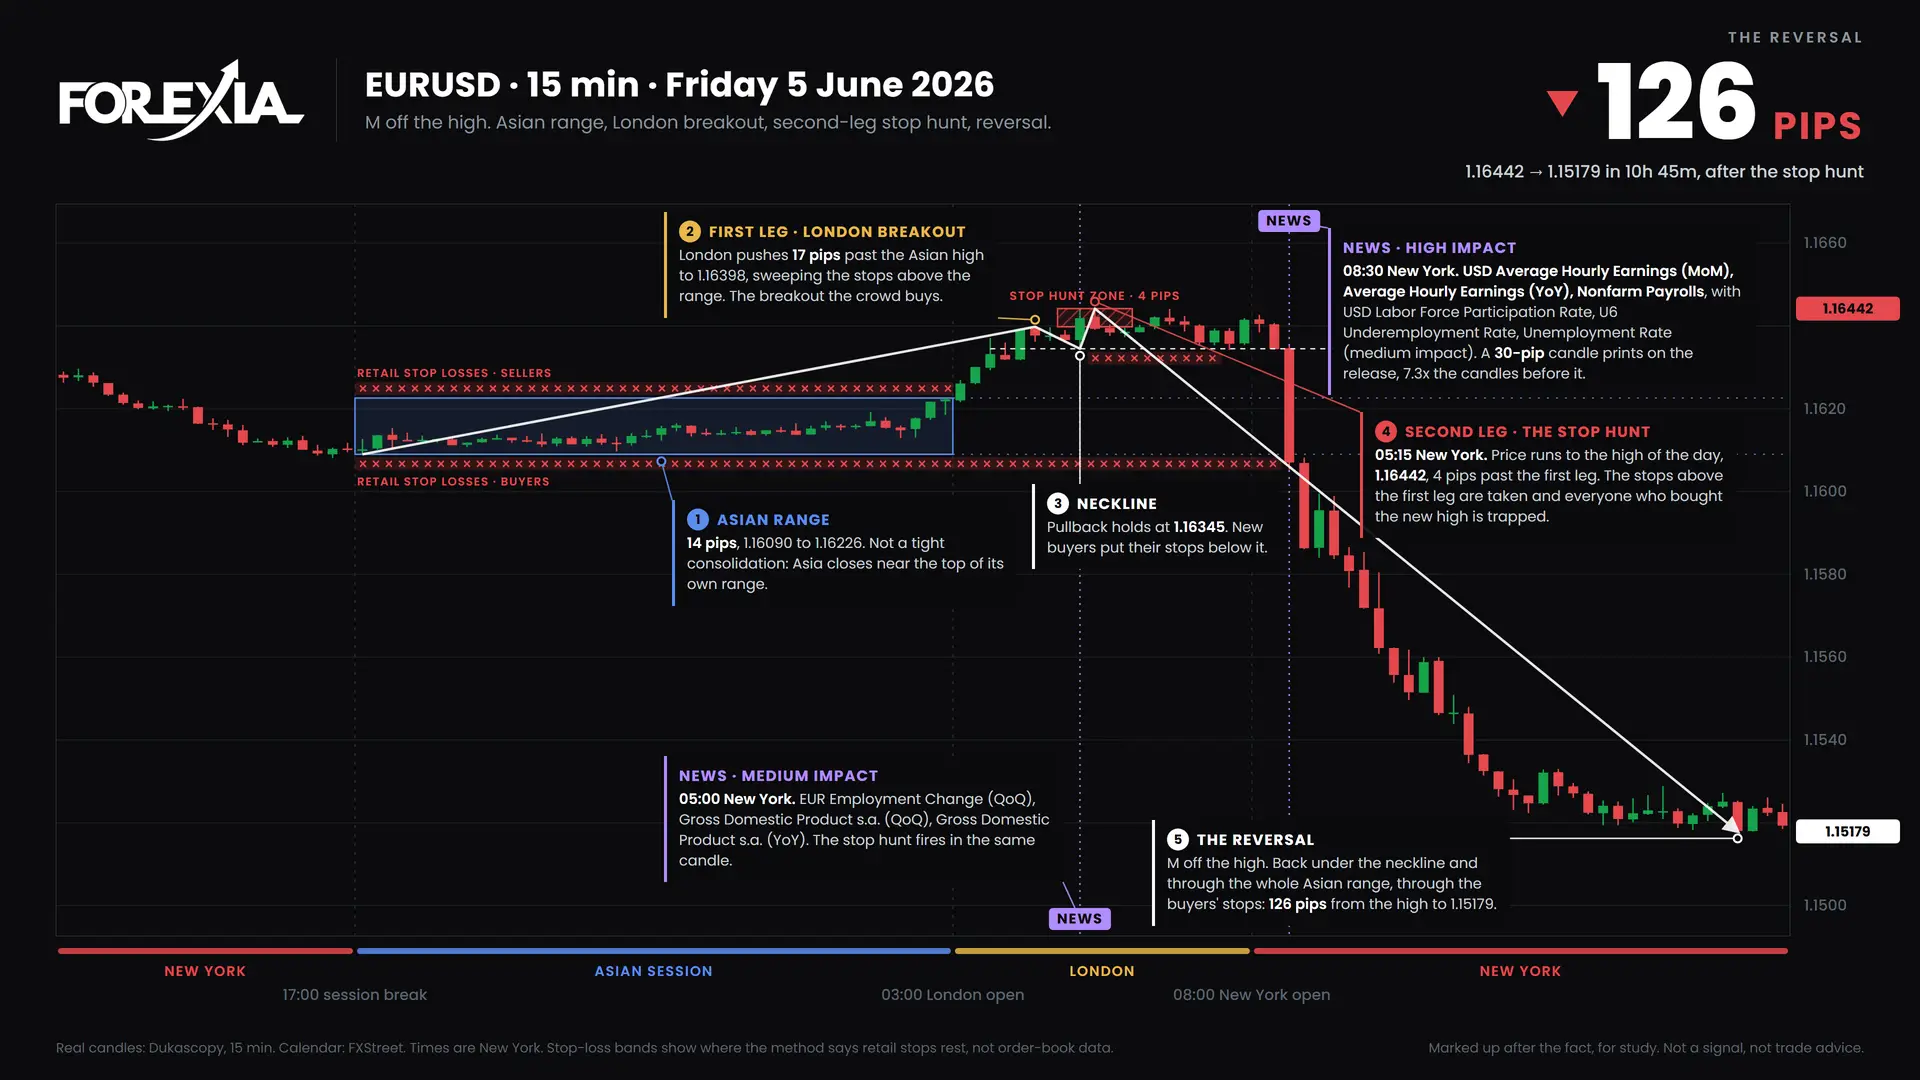
The NFP stop hunt happened hours before the jobs report: London set the trap, the release sprang it. Chart markups, week of 1 June 2026.
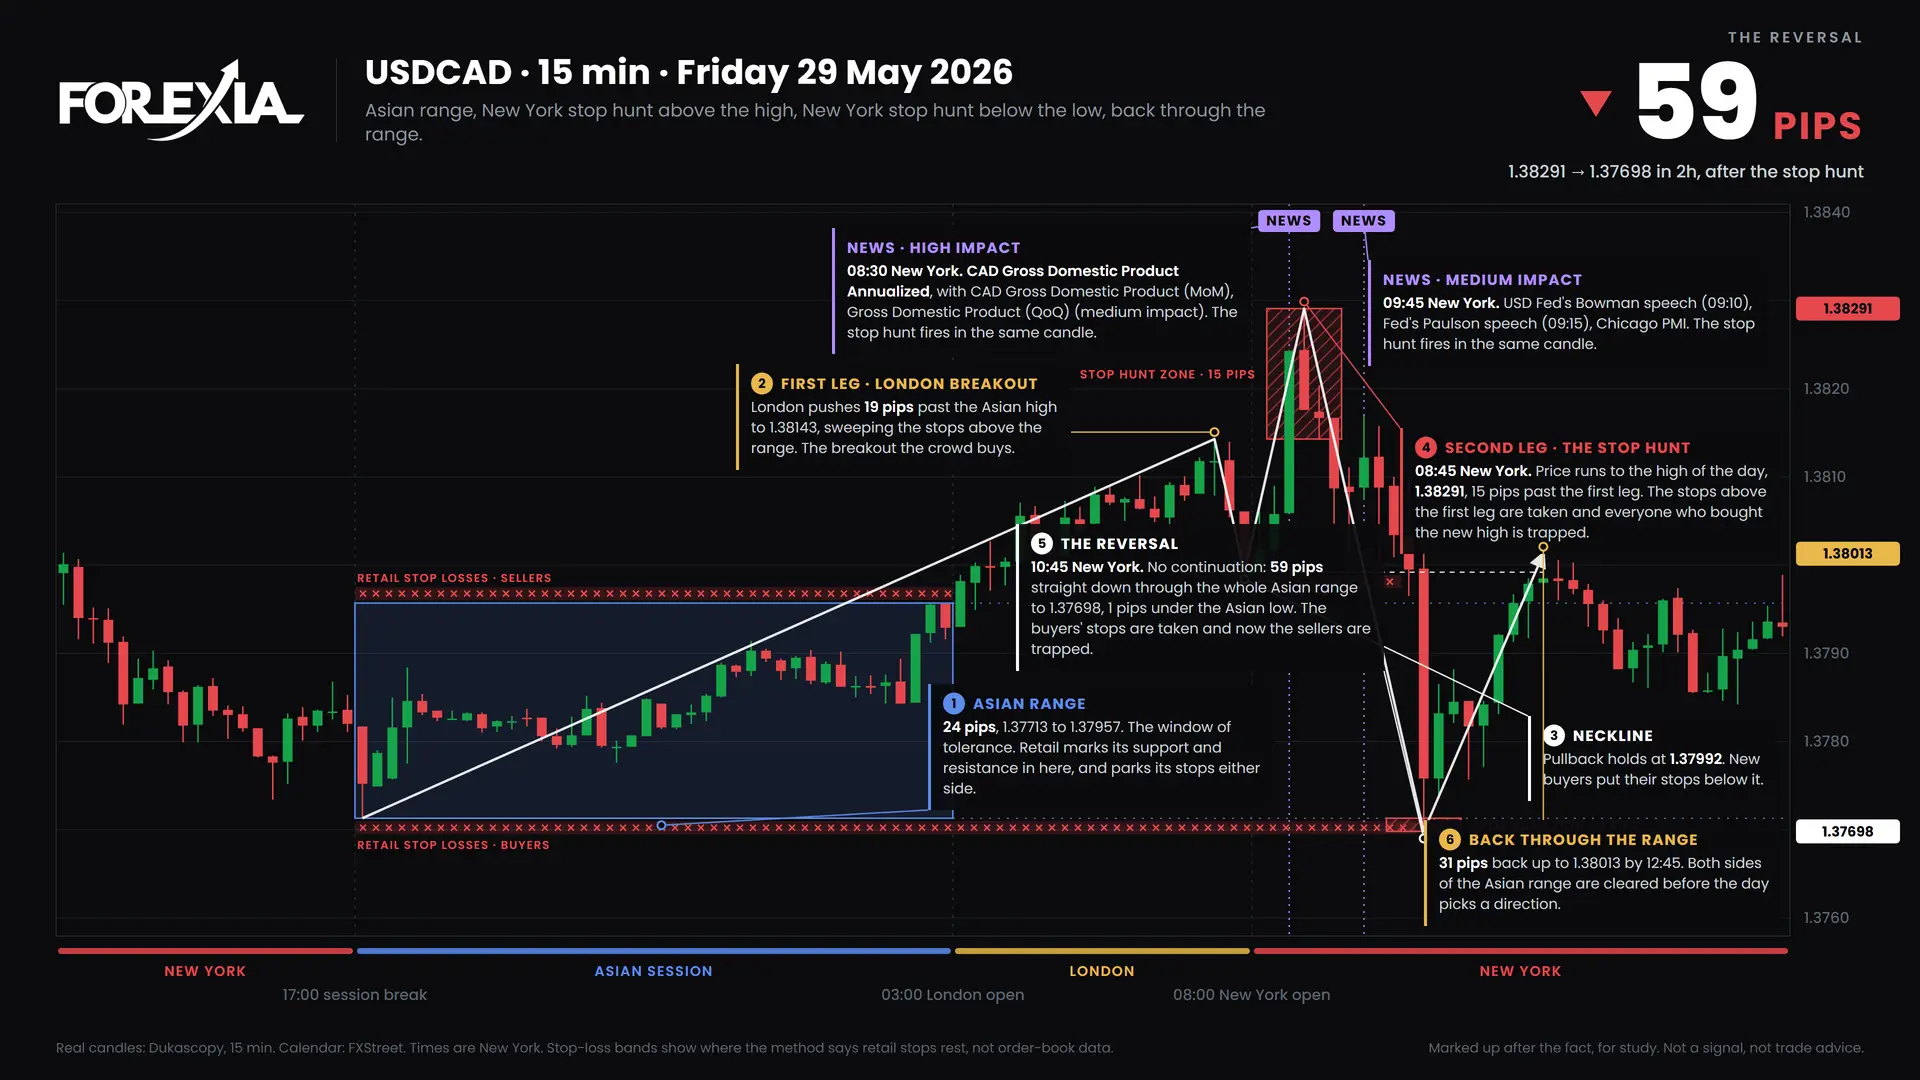
A USDCAD M formation fired on Canadian GDP and fell 59 pips, in a week where the trap came on Thursday. Chart markups, 25 May 2026.
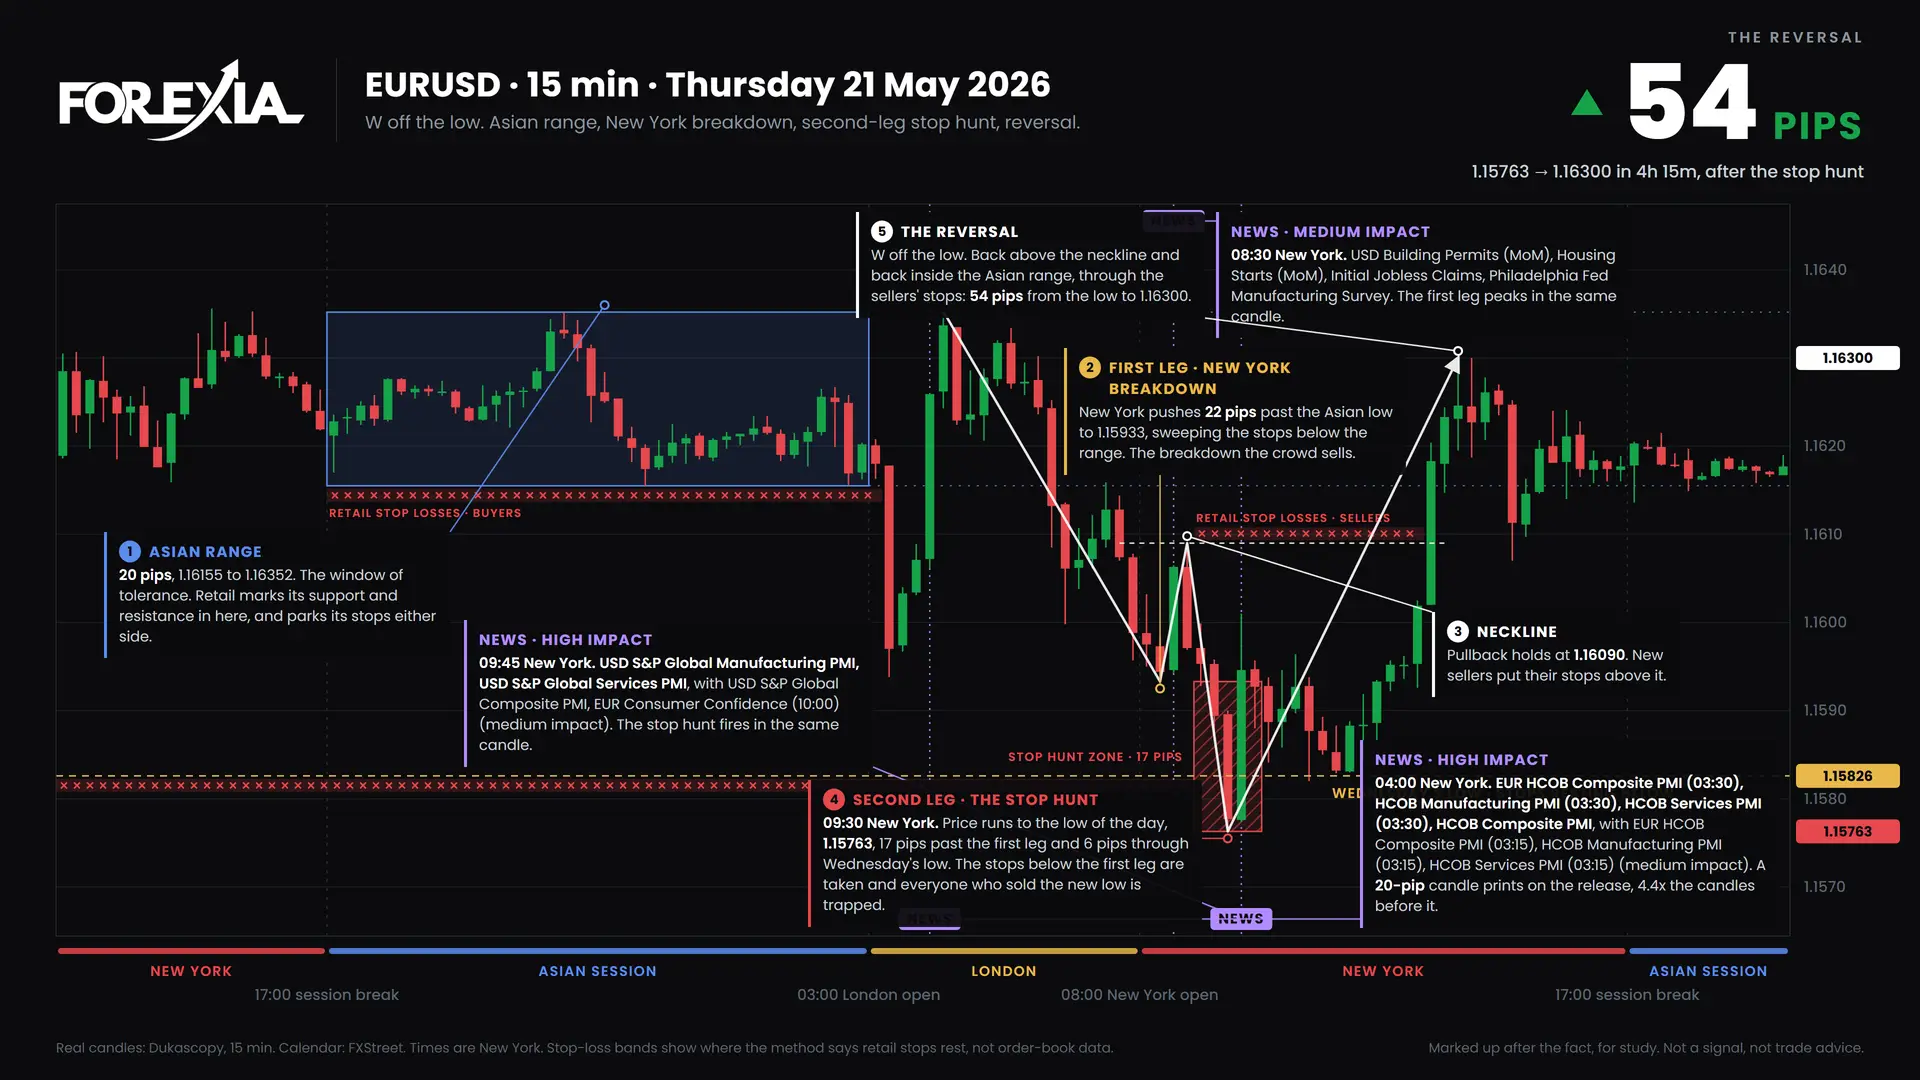
An EURUSD W formation printed the low of the week on US PMI data and scored 7 of 8. Real chart markups for the week of 18 May 2026.
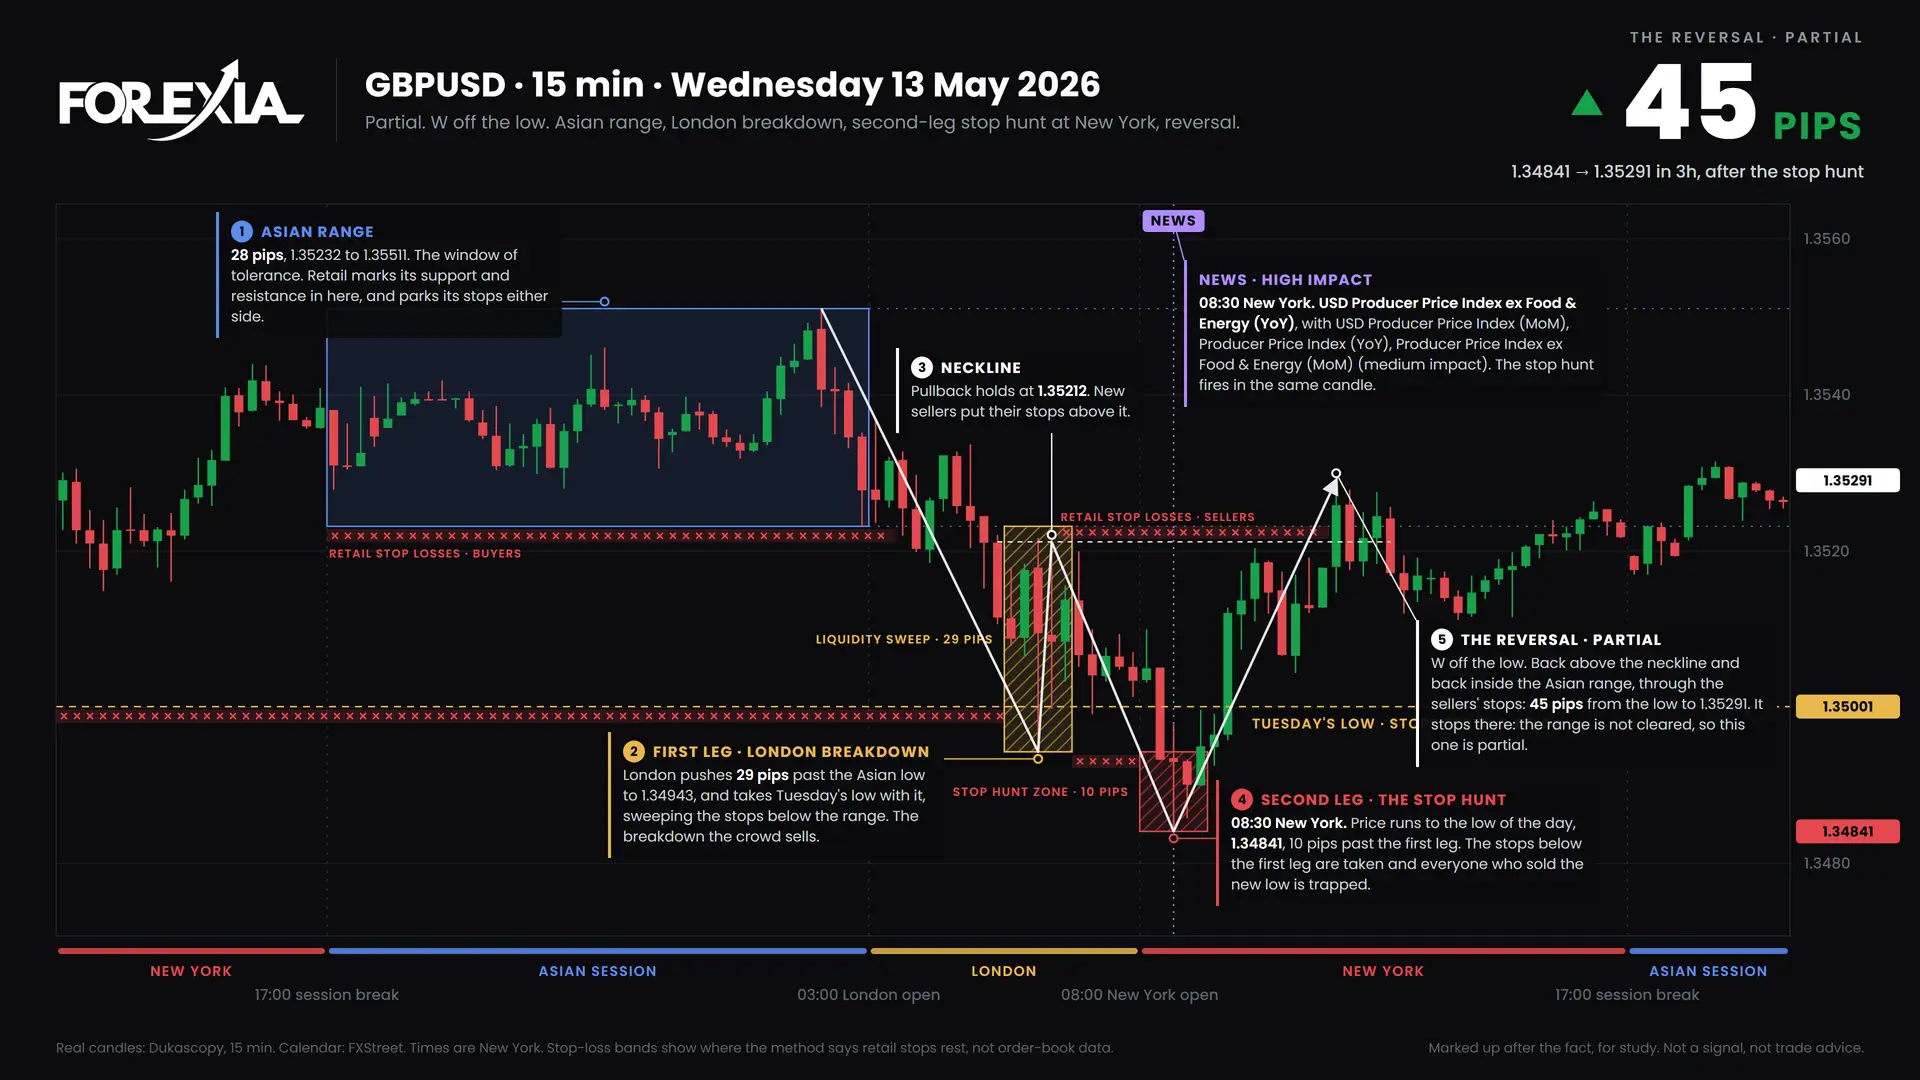
A GBPUSD W formation stacked 7 of 8 confirmations on US PPI and still only paid 45 pips. Real chart markups for the week of 11 May 2026.
The forex weekly cycle ran by the book on four pairs: induction on Monday, the trap on Tuesday, then the reversal. Chart markups, 4 May 2026.
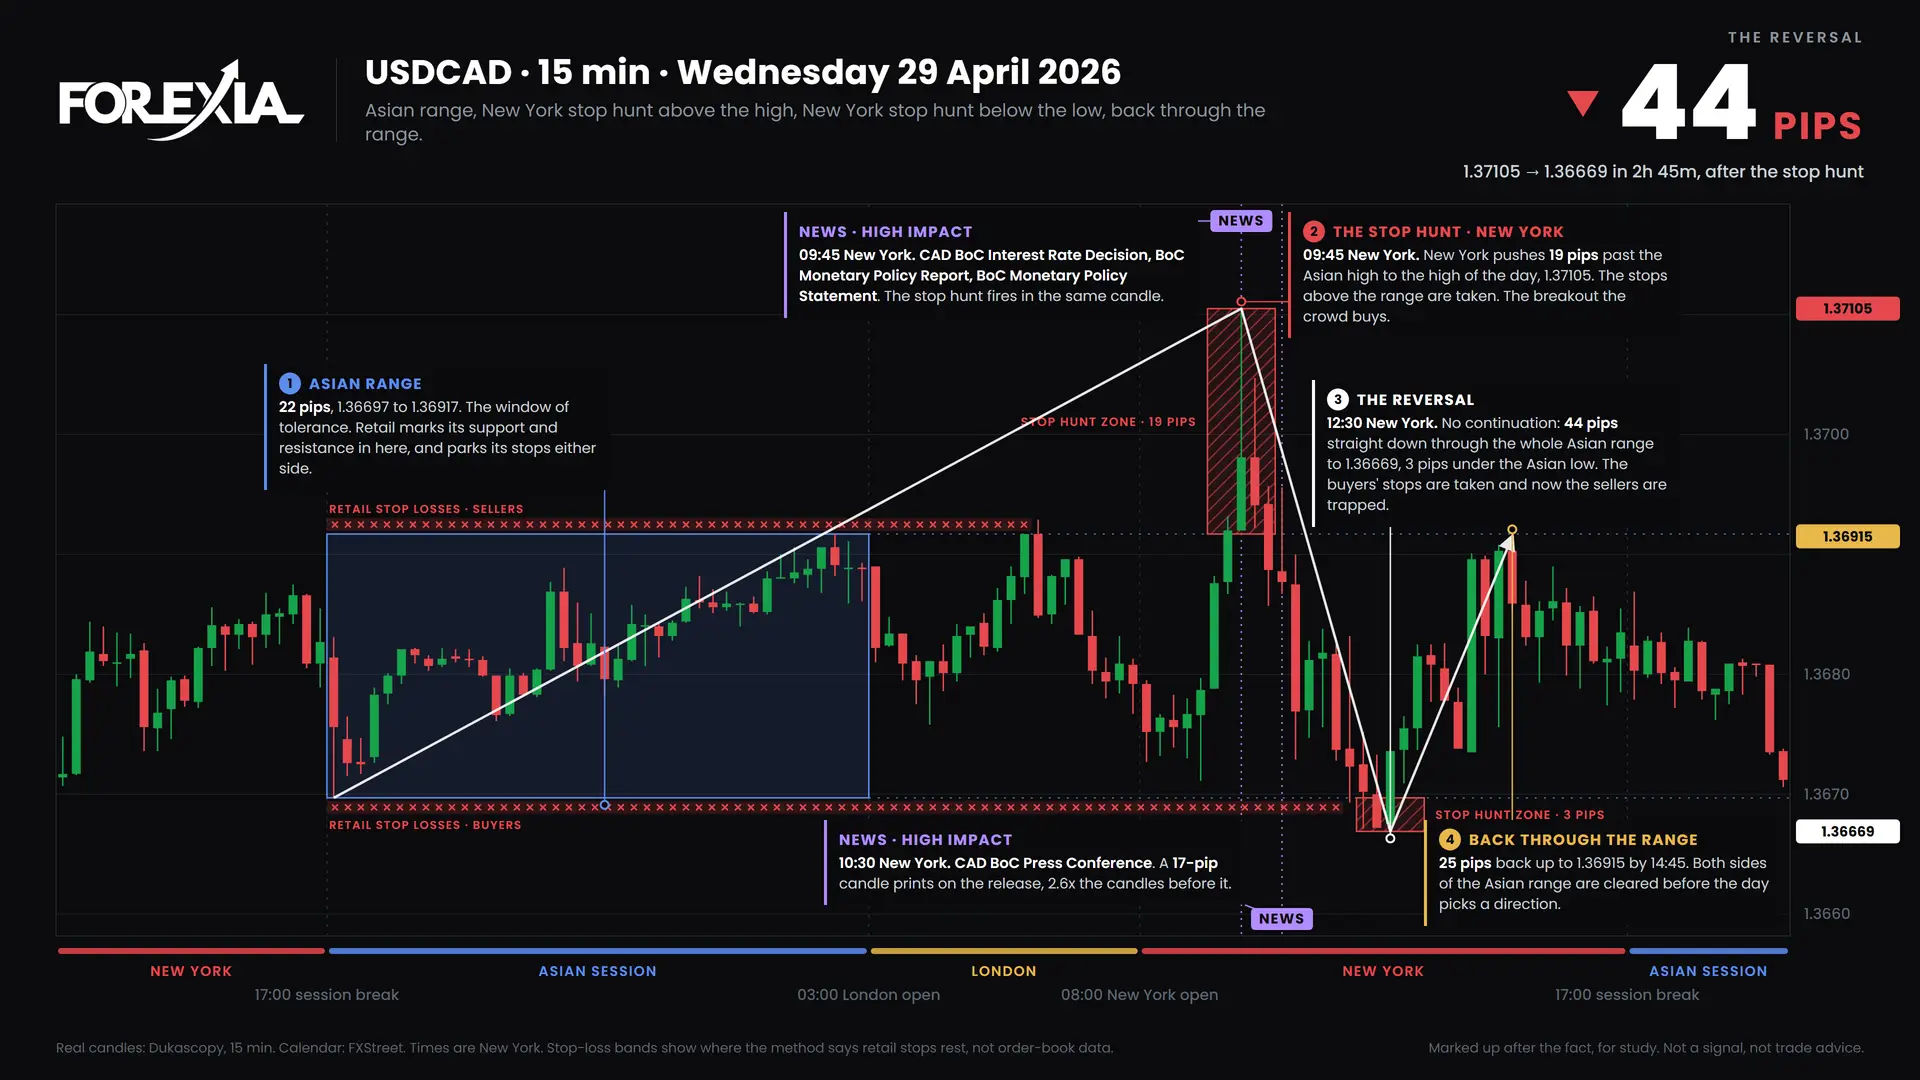
The USDCAD BoC stop hunt set the high of the week on the rate decision, then fell 161 pips. Real chart markups for the week of 27 April 2026.
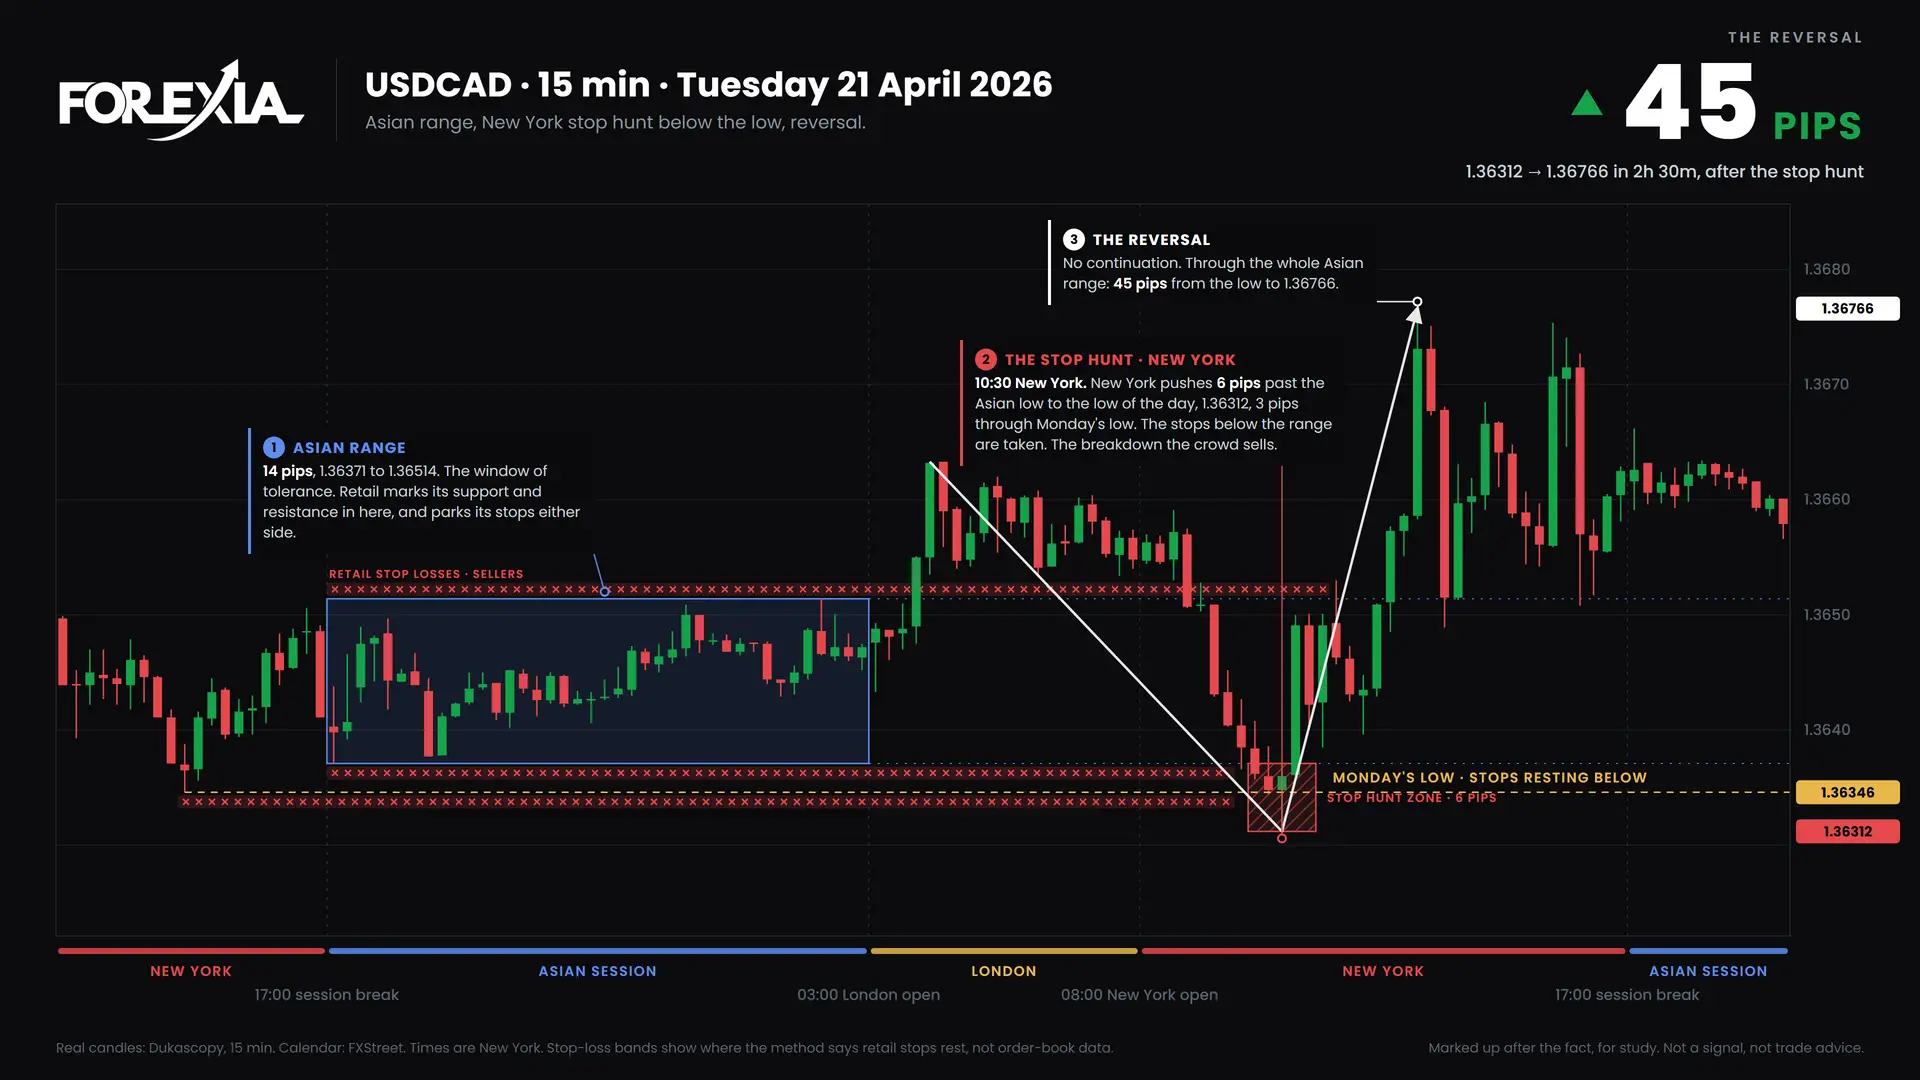
A USDCAD stop hunt under Monday's low set the low of the week, then price reversed 83 pips. Real chart markups for the week of 20 April 2026.
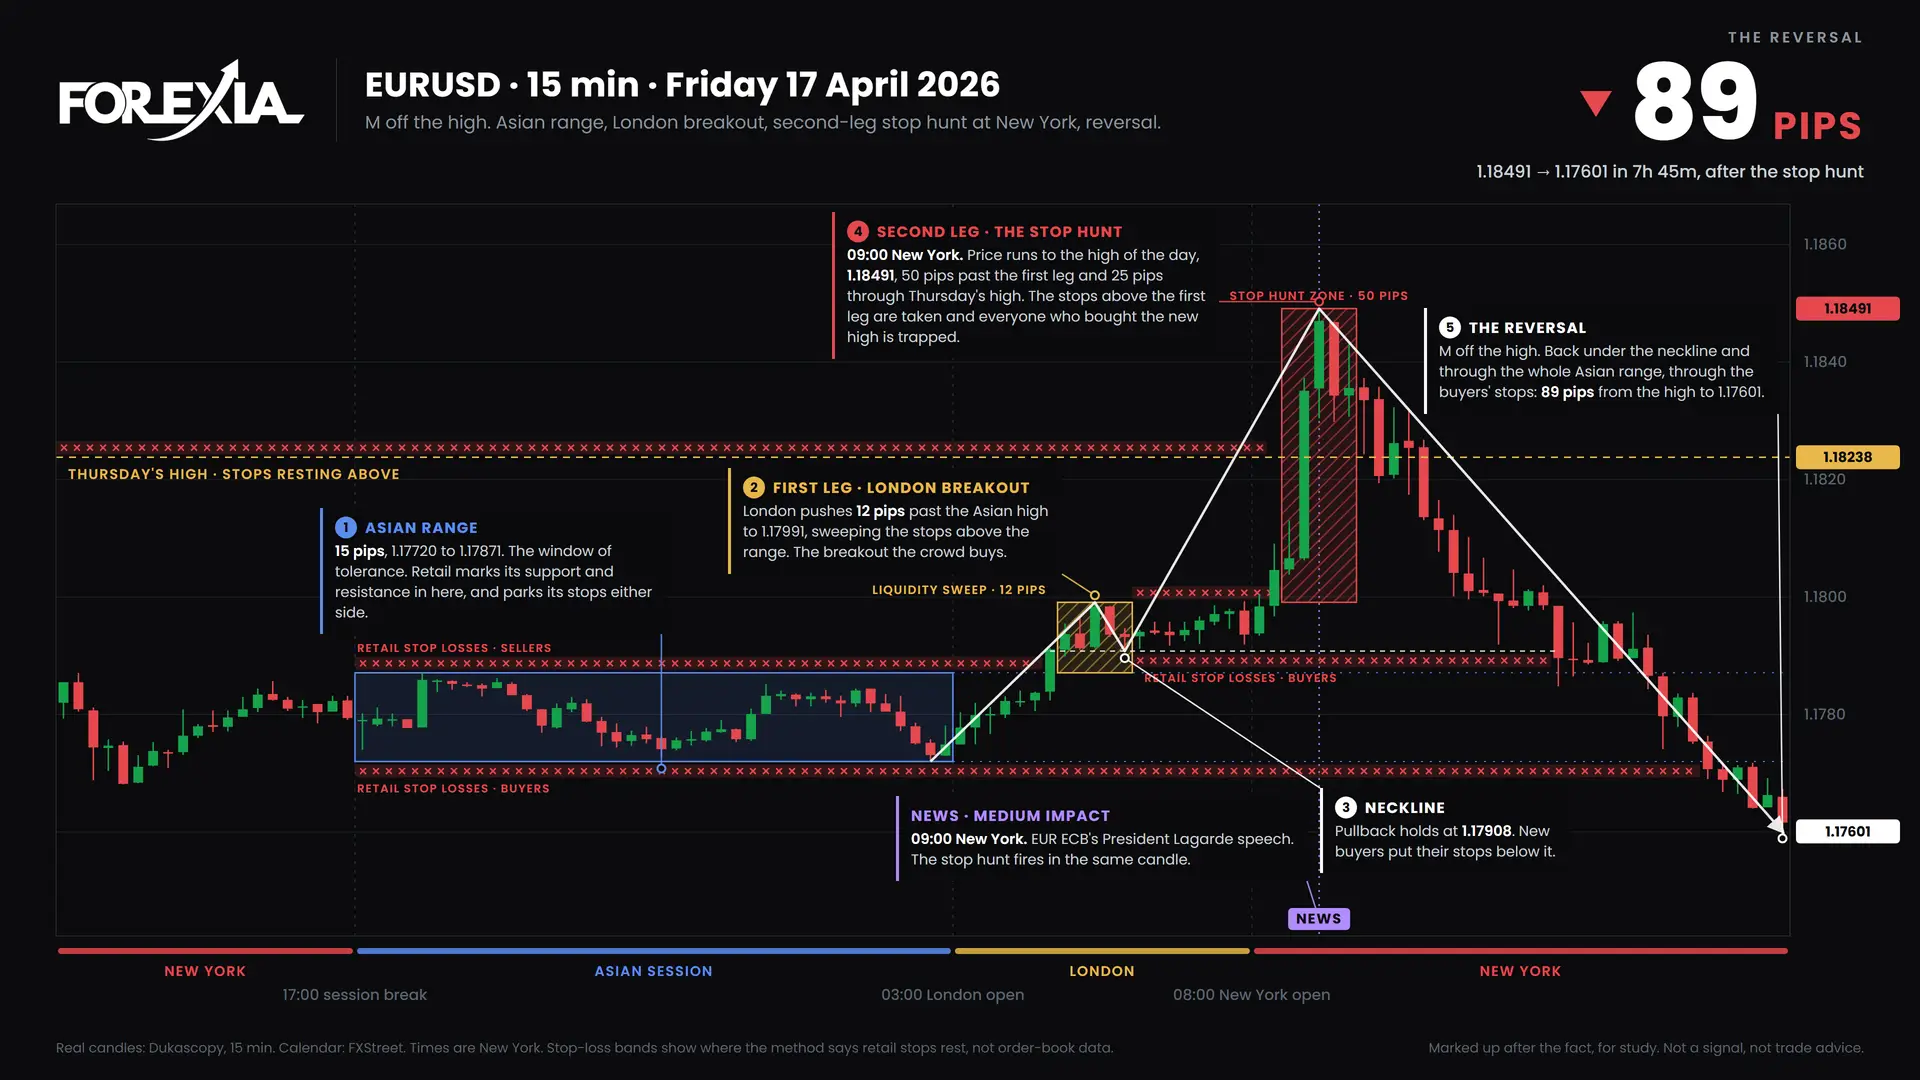
An EURUSD M formation at the New York open marked the high of the week and fell 89 pips. Real chart markups for the week of 13 April 2026.
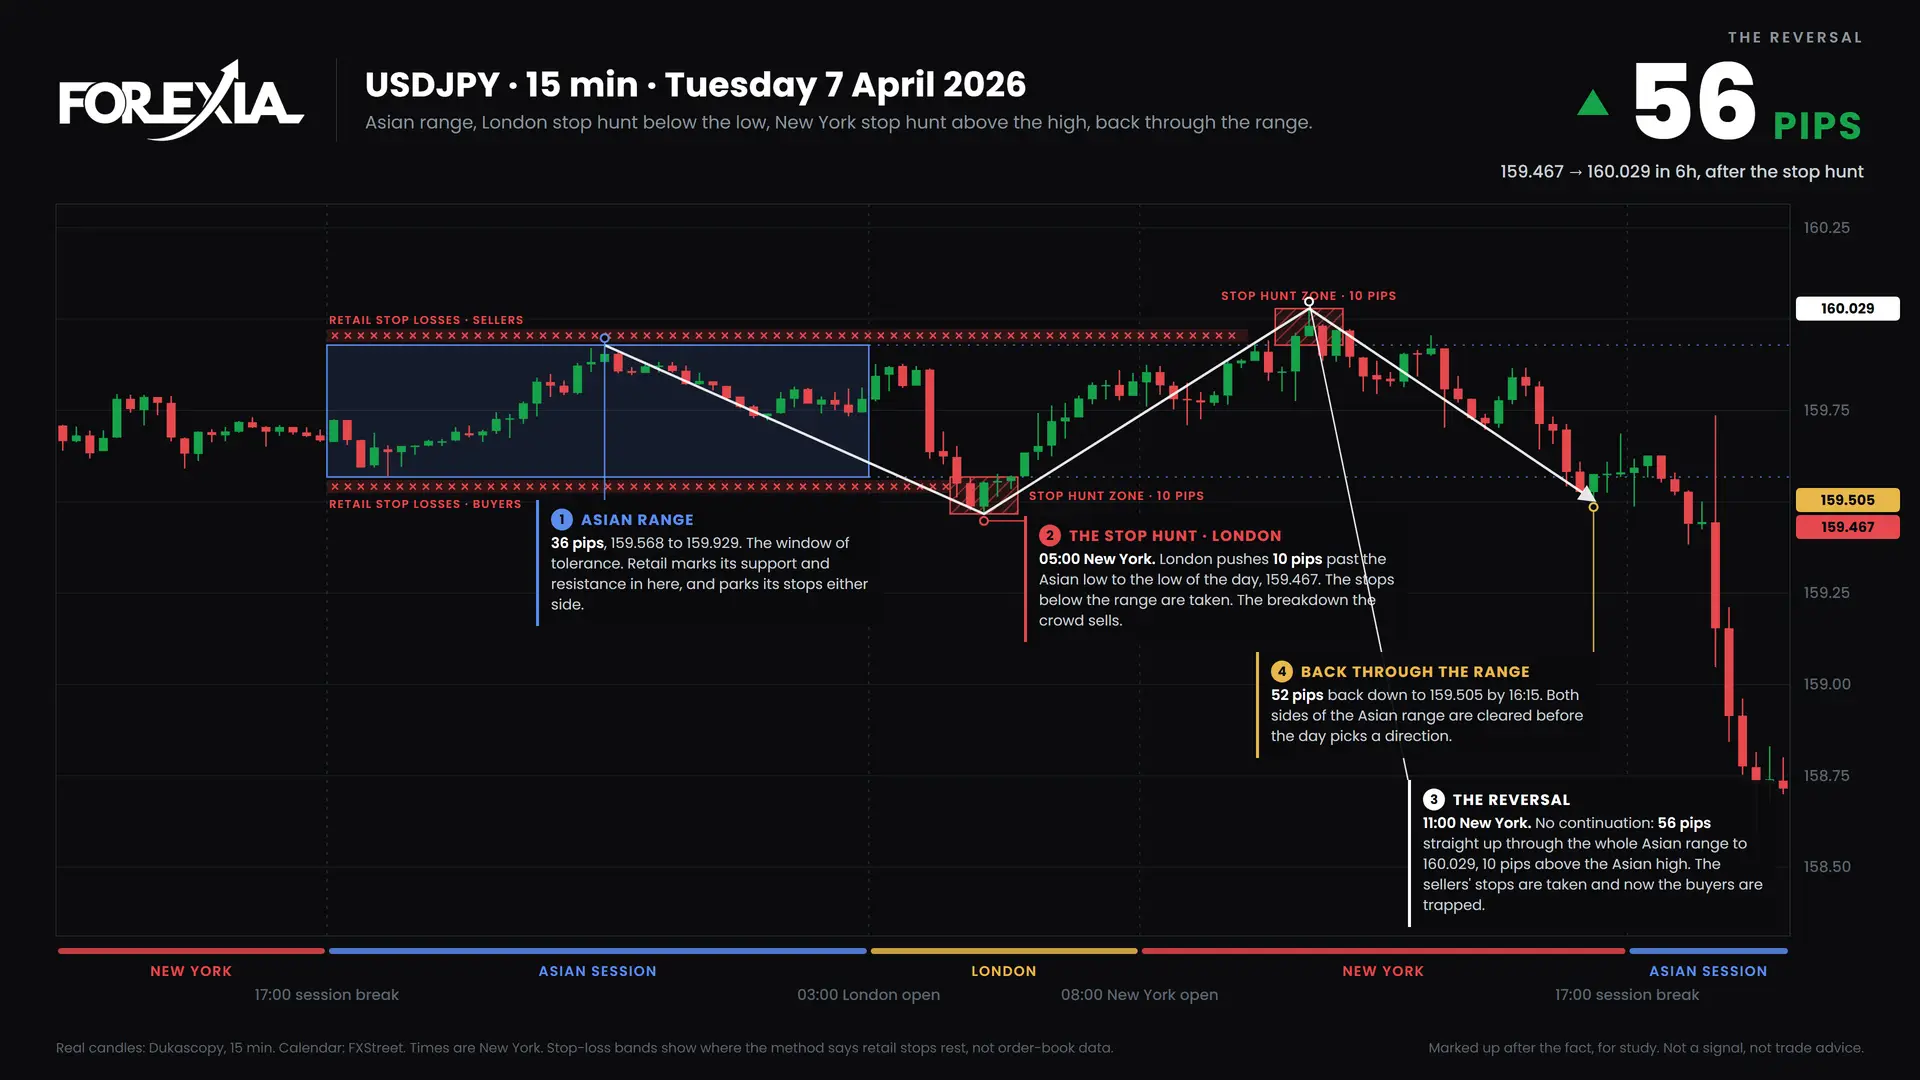
A USDJPY stop hunt took both sides of the Asian range, then price fell 215 pips. Real chart markups for the week of 6 April 2026, explained.