
COT Index: Where the Crowd Stands in Its Own Range, and How It Is Worked Out
The COT index definition is simple: it is a score that places a trader group's net position in its own past range, from 0, the most short, to 100, the most long. The CFTC publishes no such index, so every site makes its own. Ours takes the large speculators' net position as a share of open interest, over the last three years.
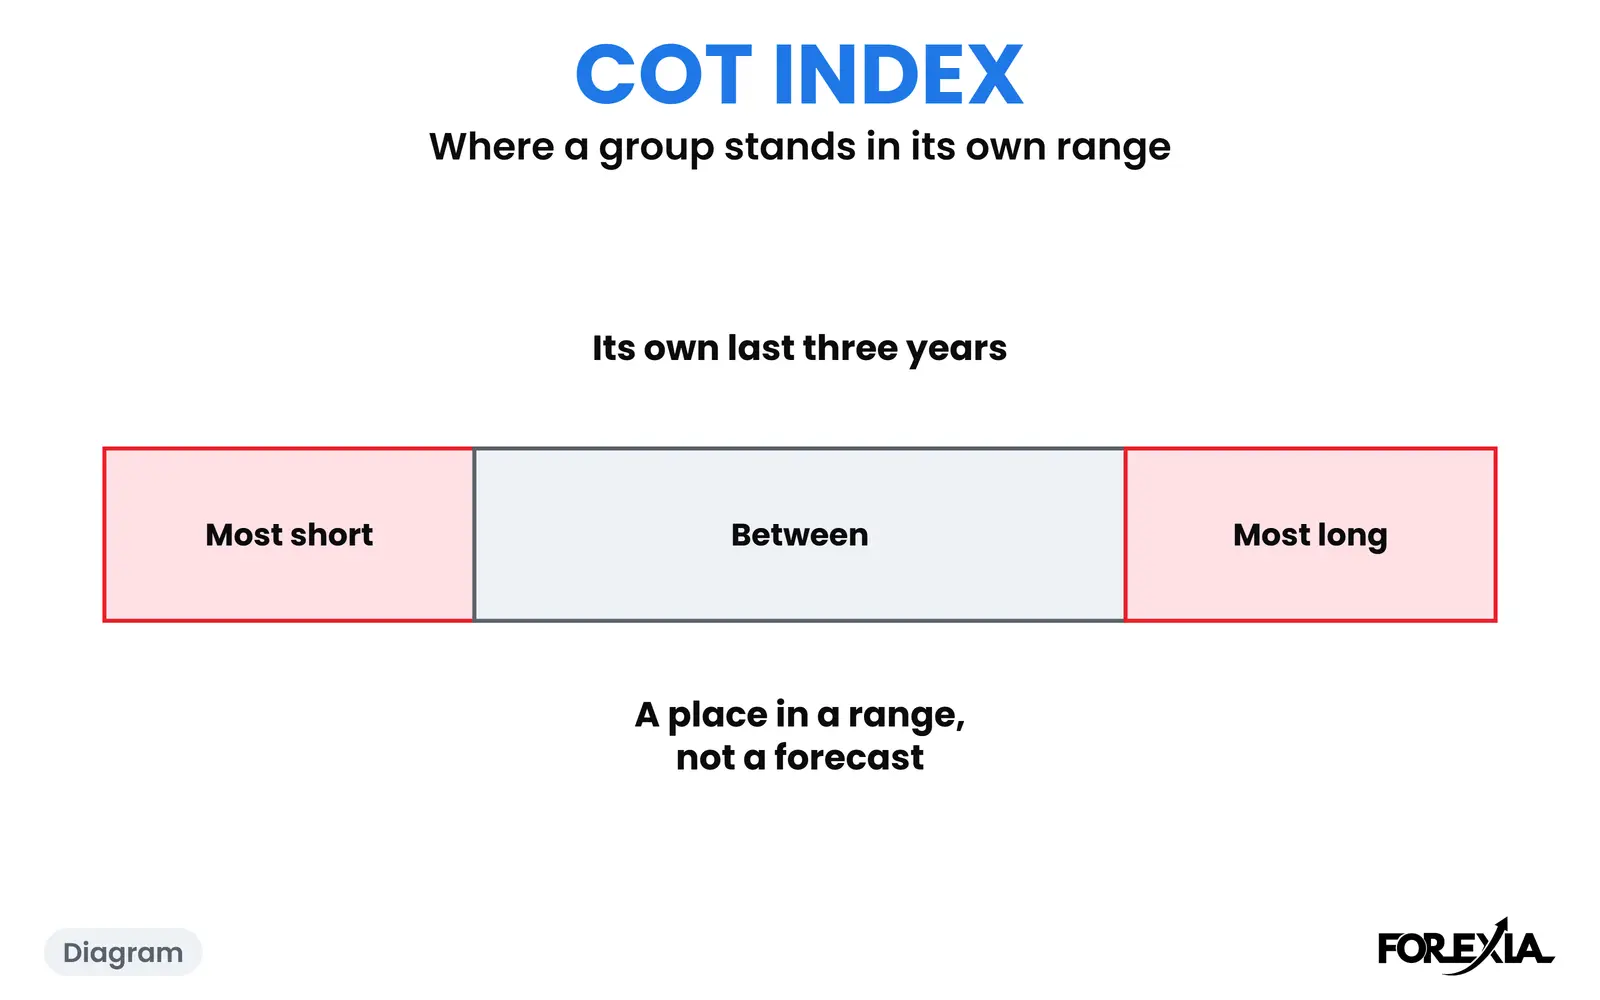
How is the COT index worked out?
In three steps, from the legacy report. First the net position: the large speculators' longs minus their shorts. Second the share: that net divided by open interest, the contracts not yet closed. Third the index: where today's share sits between the lowest and the highest of the last 156 weekly shares.
The formula is (share − lowest) ÷ (highest − lowest) × 100.
Take the Australian dollar as counted on Tuesday 20 October 2026. The speculators held 98,419 long and 225,711 short, a net of 127,292 short. Open interest was 333,010, so the share was −38.2%. The lowest share in the window was −52.6% and the highest +30.9%. The index is 14.4 ÷ 83.5 × 100, which is 17. The full row is worked column by column in how to read the COT report.
Why use a share and not the raw net?
Because open interest moves, and a raw net moves with it. Around a contract's quarterly expiry open interest can fall sharply in a week. A share keeps the reading comparable from one week to the next, and the window keeps it comparable with the market's own history, which is why a net that looks huge on one market can be ordinary on another.
Why is the index different on another site?
Because the CFTC leaves every choice open. Another tool may use raw contracts, a window of six months or a year, or a different group. The same week can then read 17 on one page and a very different number on another. When you compare two indices, compare the formulas first.
What does the COT index not tell you?
It says where a group stands in its own range. It does not say when price will turn, or that it will. The Canadian dollar shows how long a reading can last: counted on Tuesday 11 August 2026 the index was 88, and the group had stayed at 80 or over for nine reports while price fell.
An index is also only as good as its window. In the first years of a record there is less than three years behind it, so early readings are less reliable. And a reading is about futures, a sample of the wider market, as Commitments of Traders explains.
How do you use the COT index in practice?
Read it as a place and never as a trigger. A reading of 17 says the crowd is near the short end of what it has done in three years, and a reading of 88 says the opposite. Then ask three plain questions. Which group does this index follow? Over what window? And which way round is the contract, since the yen, franc and Canadian dollar futures run the opposite way to their pairs? Only when those are answered does the number compare with another week or another market.
It also helps to look at the week-to-week change in the reading, not just the level. A crowd that reaches an extreme in one week behaves differently from one that has drifted there over months, and the index alone cannot tell you which it is.
What do the ends of the scale mean?
On our pages a reading of 20 or under is crowded short and 80 or over is crowded long, and anything between is neutral. The word for that is crowded stance. The lines are our choice. Other readers use 10 and 90. For what each level tells you, see COT index meaning, and to calculate one yourself, use the COT index calculator.
Where is the COT index taught?
Course 1 of ForexiaPRO, Reading the Map, teaches the index in lesson 1.3.2, when the crowd is at the ends of its range. The same module goes on to Fade the Crowd, our read of those ends. The full subject is in the COT report hub.
Frequently asked questions
What is the COT index?
It is a score from 0 to 100 that places a group's net position in its own past range. At 0 the group is as short as it has been in the window, at 100 as long, and at 50 it sits in the middle. The CFTC publishes no such index, so each site makes its own.
Why does another site show a different COT index for the same week?
Because the formula and the window are choices. Some tools use raw contracts in place of a share of open interest, and some use six months or a year in place of three years. Check the formula before comparing two numbers.
Does a COT index of 10 mean price will rise?
No. It says the group is near the short end of its own range. It holds no information about when, or whether, price turns, and a reading can stay at an extreme for months.
How often does the COT index change?
Once a week, because the report is weekly. A new reading arrives with each Friday release and describes the Tuesday before.